Case Study
1. Introduction
Canopy is an open-source real-time monitoring framework designed specifically for use with the Amazon CloudFront CDN. We automate the deployment of an end-to-end pipeline for collecting, transforming, and storing Amazon CloudFront CDN logs, and process those logs to generate a critical suite of metrics for analysis.
In this case study, we introduce CDNs and discuss why you would want to monitor the CDN. Next, we discuss the challenges of working with CDN data and existing real-world solutions. Finally, we outline the evolution of Canopy’s architecture, from an initial prototype, to its current form.
2. What is a CDN and Why do we Need to Monitor it?
Before we discuss how Canopy works, we need to review some basic concepts, including CDNs, monitoring, and what specifically can be gained from monitoring the CDN.
2.1 Content Delivery Network (CDN)
A Content Delivery Network (CDN) is a geographically distributed network of servers that stores cached versions of web content - HTML pages, images, video and other media - at locations closer to end users. Using CDNs can improve the performance of web applications in two primary ways:
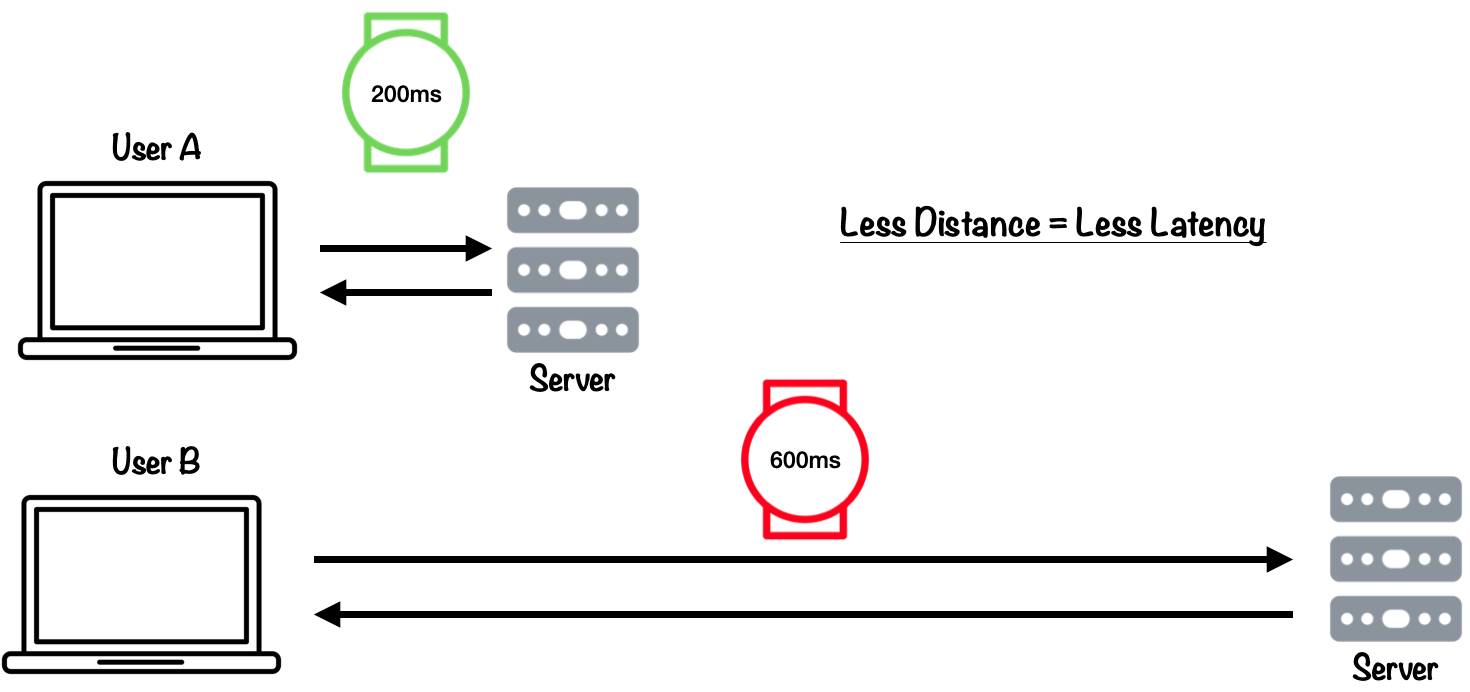
Reducing latency for end users. When a user visits a website, the data they are trying to retrieve must travel across the network from the website owner’s server (or origin) all the way to their computer. If a user is located very far from the origin server, they will experience higher latency than a user located nearby. In the image below, User B is located farther from the origin server than User A, and so experiences 400ms of additional latency.
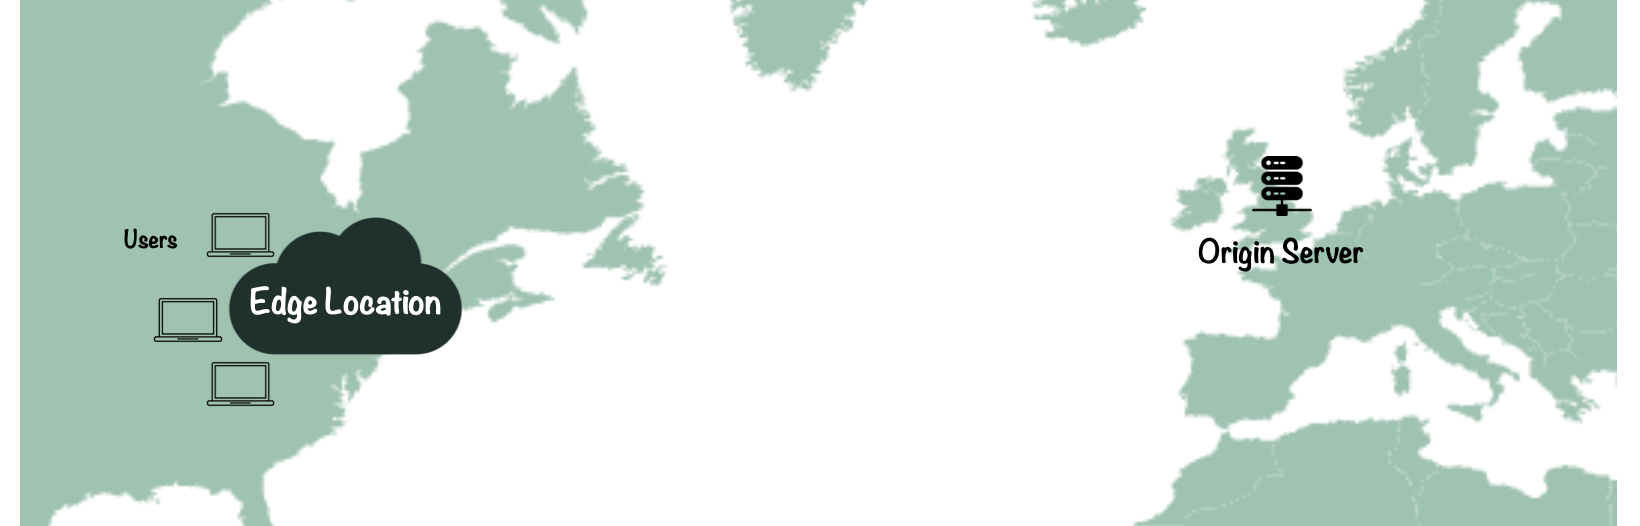
CDNs reduce latency by hosting data across many different regions, ensuring that users in different areas receive similar response times. See the image below, where users in the US East Coast need to access a website with origin servers based in London. Instead of every request they make being served by the UK Origin server, a majority of their requests are served by the CDN edge location closest to them, reducing the distance the data travels and providing a faster experience for the user.
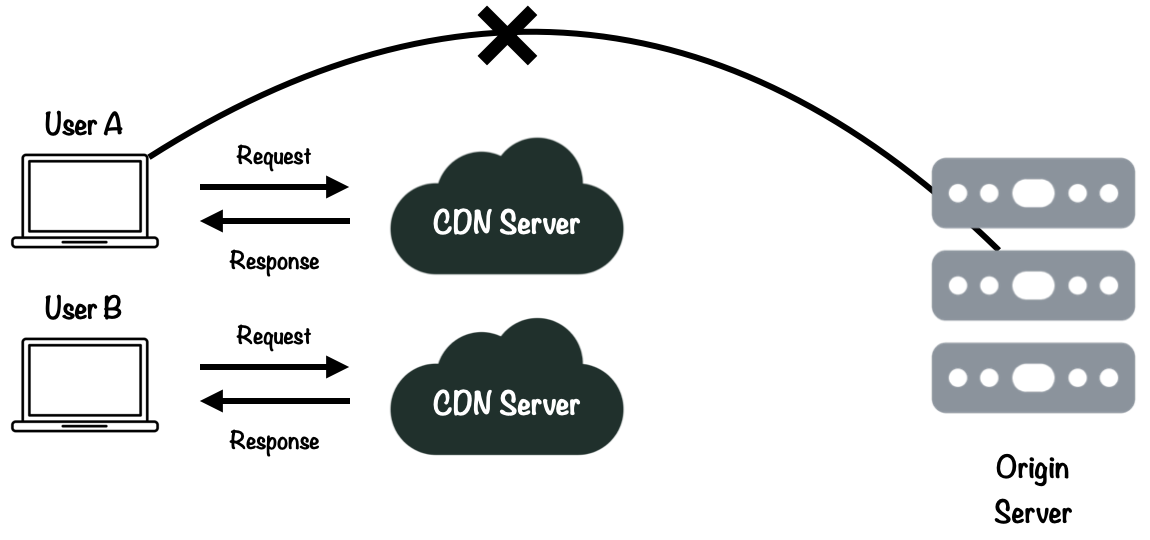
Reducing the request load on the origin server. The second major benefit that comes from using CDNs is they can lower the load on a company’s web servers, otherwise known as origin servers. A request fulfilled by the CDN is a request the origin server doesn’t have to address, reducing both bandwidth at the origin, and the system resources required to process requests.
CDNs can improve the performance of web applications. But in order to gain insights into how the CDN is functioning, developers need to monitor the CDN.
2.2 Monitoring
In software engineering, monitoring is a process developers use to understand how systems and code are functioning. Google describes monitoring as: “Collecting, processing, aggregating, and displaying real-time quantitative data about a system.”[1]
By visualizing aggregated data, it’s much easier for developers and system administrators to recognize trends and gain insight into the health of a system. In order to monitor a system, we need to collect data, specifically telemetry data.
Telemetry
Telemetry data is “data that production systems emit to provide feedback about what’s happening inside the system”.[2] The three main telemetry data types used in software engineering are logs, metrics, and traces.

CDNs primarily emit Log data, which can be used to generate metrics.Traces are important when monitoring distributed systems, but are less relevant to our use case.
Logs and Metrics
Logs are timestamped records of events that occur within a software system. They provide detailed and precise information, are often human-readable, and tend to be verbose compared to other types of data. Logs come in many formats and vary greatly depending on context.
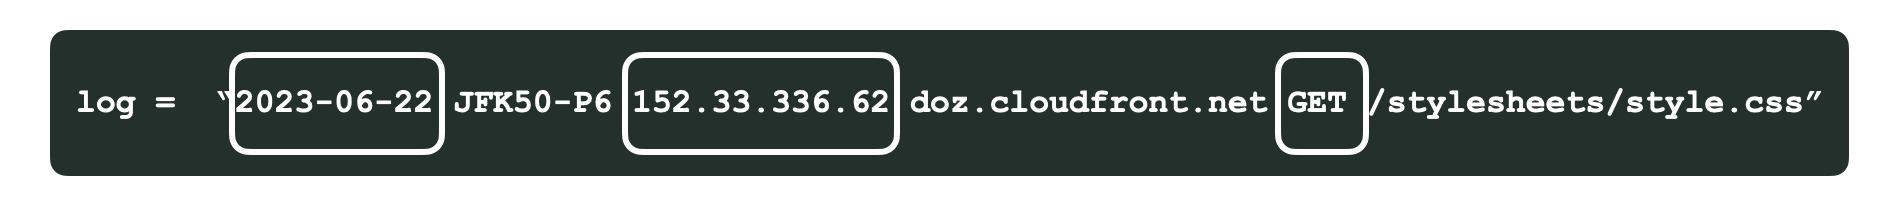
The primary way to monitor the CDN is through analysis of log data, or CDN logs. The image below shows a CDN log. It contains information about the date the event occurred, IP address of the client, as well as other information, such as whether the CDN was able to serve the client directly (cache hit), and information related to the requested content.
When we want to understand a particular aspect of a system in more detail and how it changes over time, we turn to metrics.
Metrics are a numerical representation of data. They are usually smaller in size than logs, have fewer fields, and measure a single aspect of the system being monitored. Metric data can be presented in a dashboard, offering a comprehensive view of a system’s overall health.
Monitoring log and metric data provides developers with insights they need to debug, optimize and analyze their applications. But why would developers need to monitor the CDN specifically?
2.3 Why Monitor the CDN?
CDNs are a "black box"
Due to their performance advantages, CDNs have become an indispensable piece of infrastructure for public-facing web applications. CDNs currently handle an estimated 72% of all internet traffic,[3] including dynamic content and streaming video and audio.
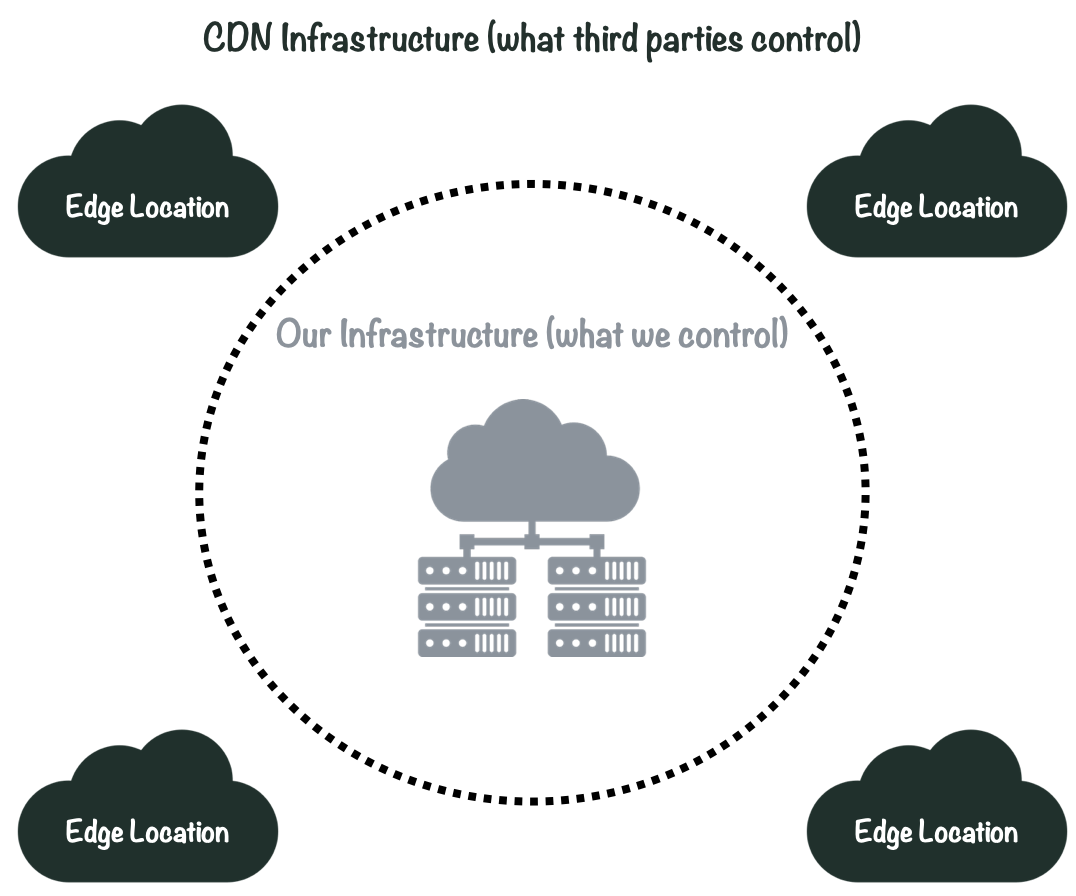
However, CDNs are in many ways a “black box”. The physical infrastructure that makes up the CDN is operated by third parties and largely outside of our control: we can’t just “ssh” into a CDN to see what is going on. Therefore, monitoring the logs generated from CDN traffic is one of the only ways to gain some level of observability into this system.
CDN Logs Contain Valuable Data
Additionally, because so much user activity is served directly by the CDN, CDN logs are full of valuable information which can be used to answer diverse questions about our web applications, including questions related to user behavior, latency, security and beyond.[4]
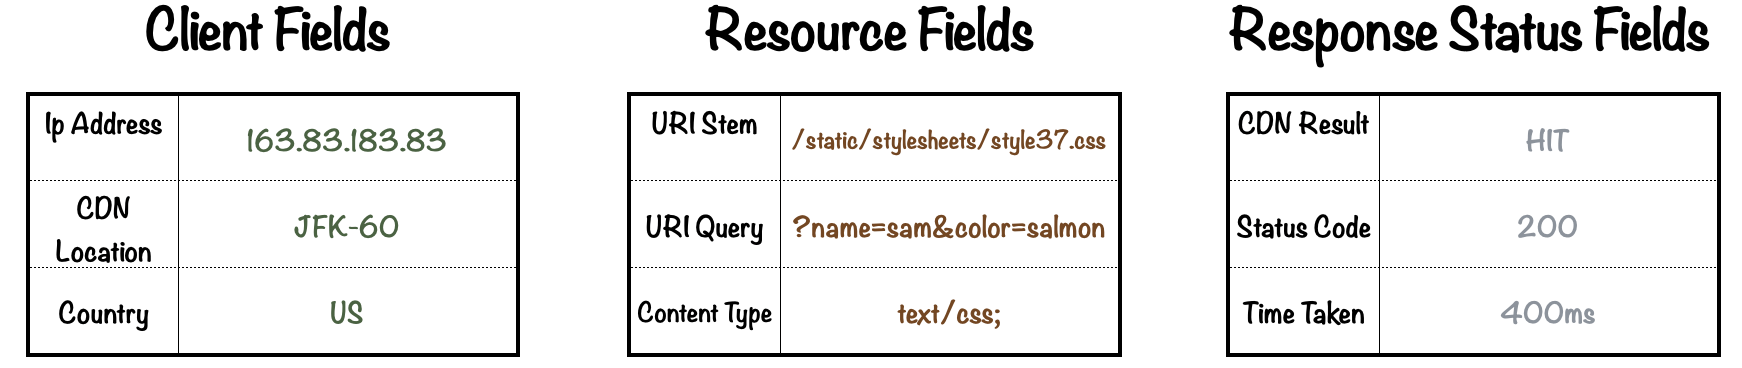
The image below shows examples of information found in CDN logs. Client Fields relate to the client (or user) that sent the request. Resource fields relate to the information they are trying to access. Response fields relate to the success or failure of the request to the CDN.
The information in these logs can provide insights into fundamental metrics of system health corresponding to the four golden signals of monitoring.
The Four Golden Signals
Google identified the four golden signals of monitoring: Latency, Traffic, Errors and Saturation. Taken together, these four signals serve as a guidepost for monitoring teams and provide developers with a well-rounded understanding of what is happening in production systems.
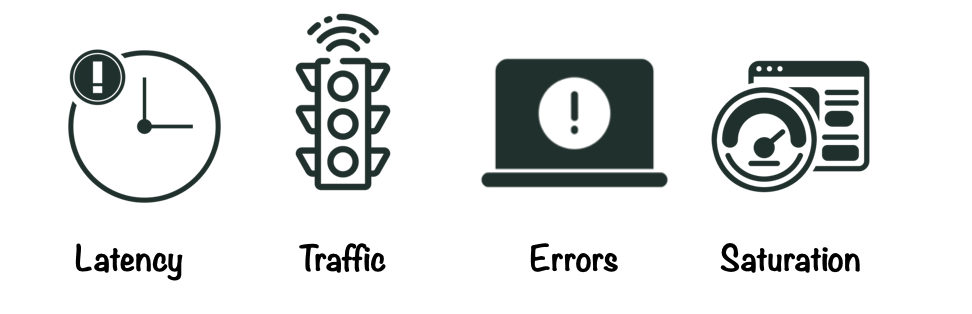
Latency refers to the time it takes to service a request. Latency directly impacts user experience and is a primary indicator for the performance of a system.
Traffic refers to how much demand is being placed on a system. Traffic can vary according to time of day or by region and can be difficult to manage without sufficient data.
Errors refer to the rate of requests that fail, i.e. 4xx and 5xx status codes. Errors may be isolated to a specific region, time of day, or resource path, and identifying these trends is key.
Saturation refers to the load on the network and servers relative to capacity (i.e. “system fraction”). Measuring saturation can help identify bottlenecks in a system.
CDN log data can generate metrics that correspond to the golden signals, for example, “90th percentile time to first byte (TTFB)” for latency.[5] However, in order to monitor data from the CDN, it is necessary to transport and process that data to a central location where it can be used. Let’s take a look at what goes into building a data pipeline for taking CDN logs from the source all the way to visualizing those metrics in a dashboard UI.
3. Building a Logging Pipeline
Data pipelines are systems that process and move data from a source to a destination, where it can then be analyzed. Data pipelines for telemetry data are essential to software monitoring.[6]
A logging pipeline is a kind of data pipeline for log-based telemetry data. Logging pipelines allow us to collect, visualize and analyze log data for software monitoring and data analysis.
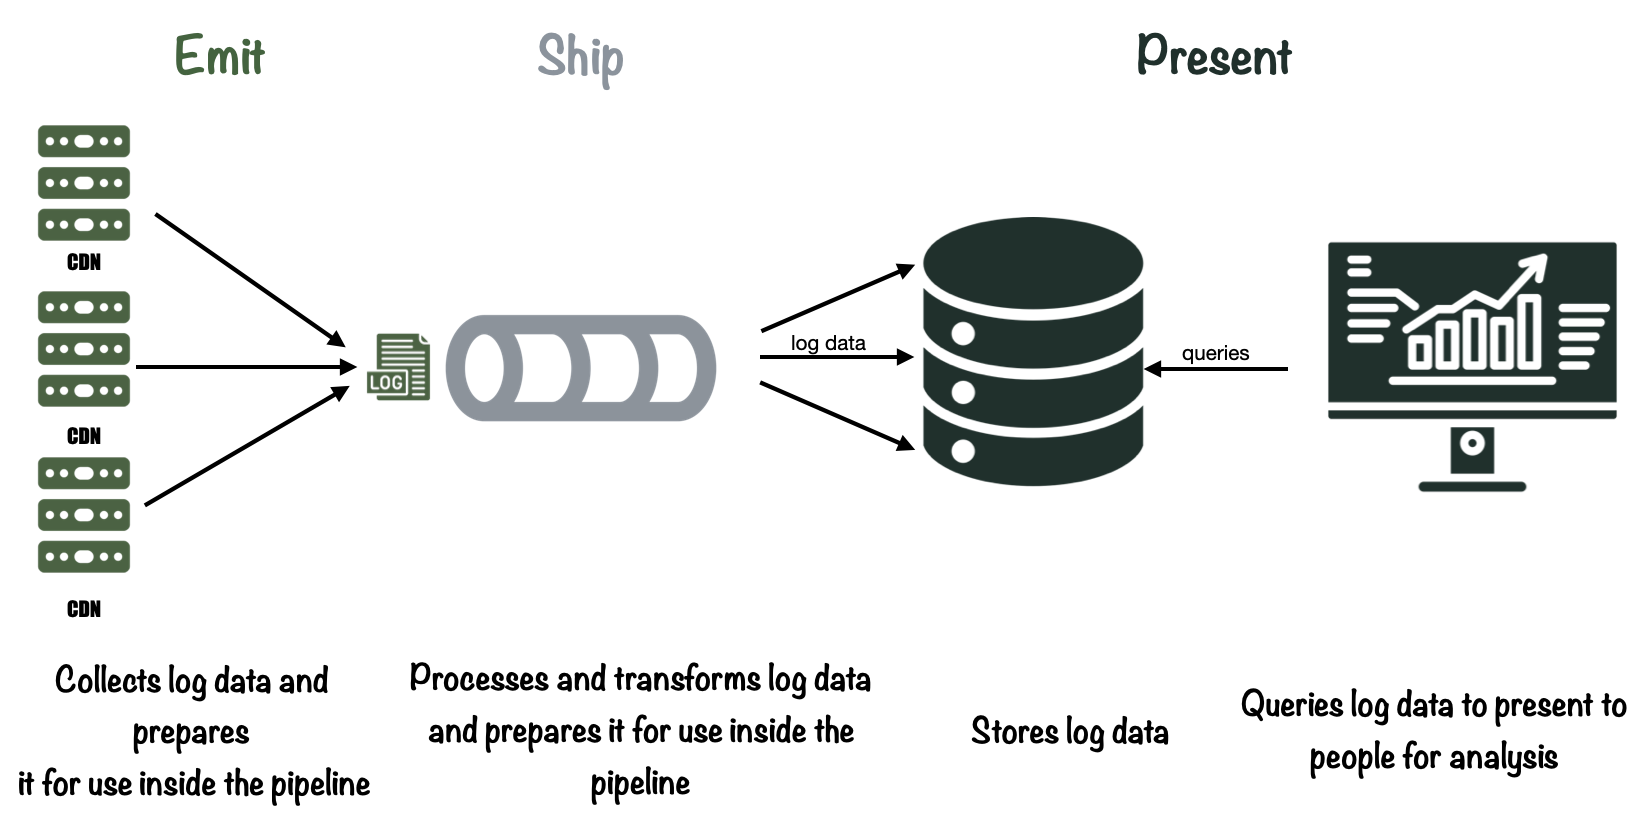
To better define what makes up a typical logging pipeline, we use the model for telemetry pipelines outlined by Jamie Riedesel in her book Software Telemetry. Riedesel identifies three key “stages” for telemetry pipelines, Emitting, Shipping, and Presentation.[7] Taken together, these three stages describe the flow of telemetry data as it moves through a pipeline.
Let’s look at each stage.
3.1 Emitting
First is the emitting stage. In the emitting stage, data is accepted from production systems and prepared for shipment in the logging pipeline.

3.2 Shipping
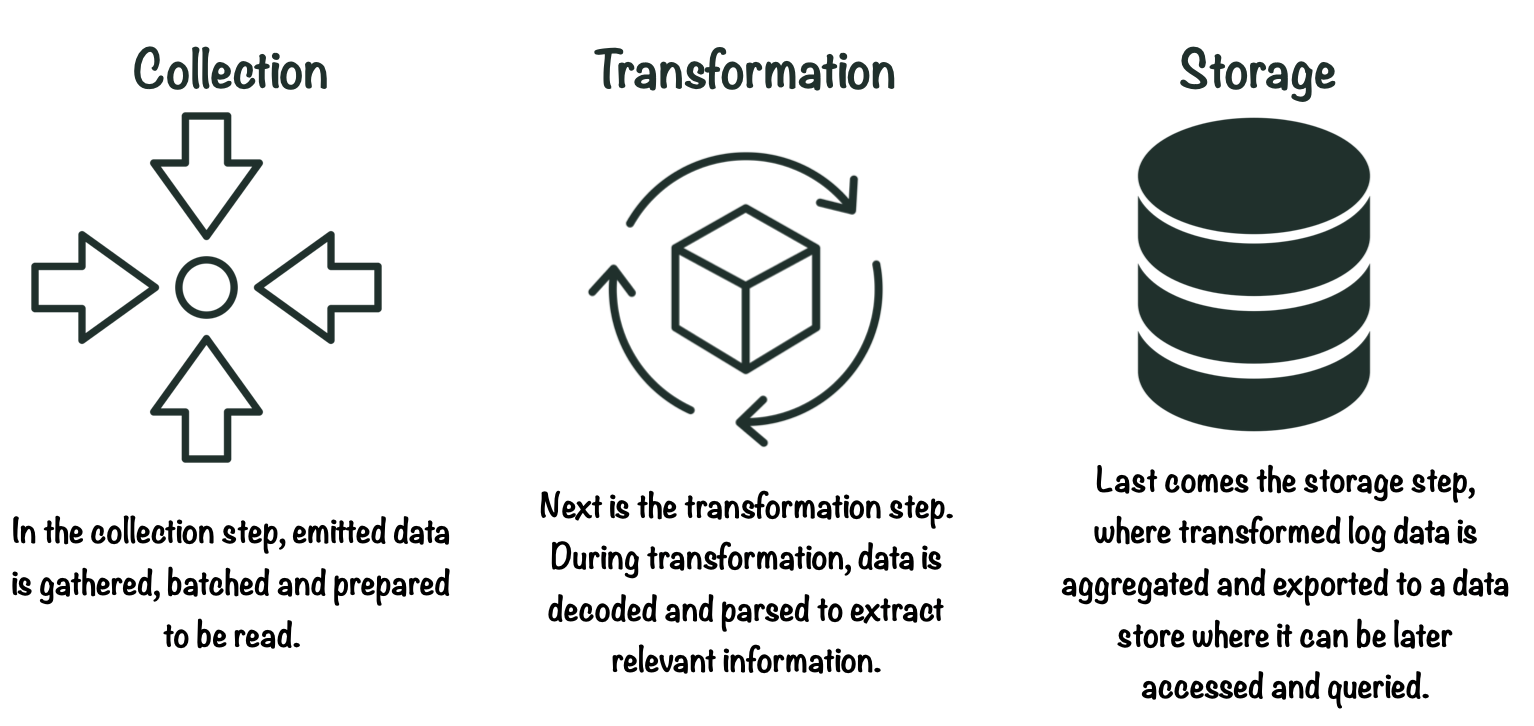
The shipping stage takes raw log data from the data source and moves it to storage. In order to do this, there are 3 necessary steps: Collection, transformation and storage.
3.3 Presentation
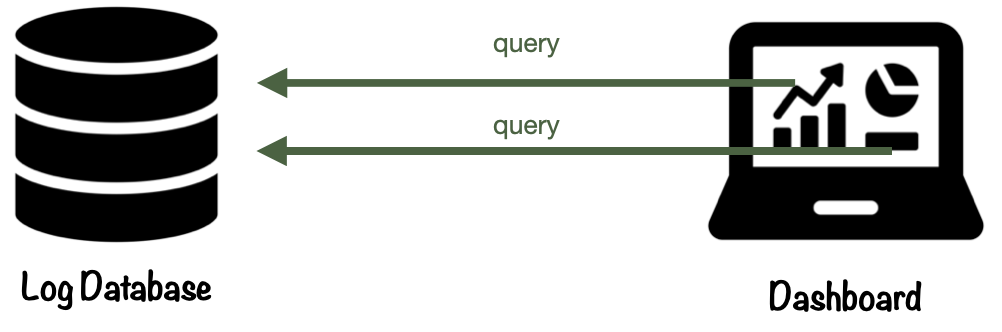
The final stage in a logging pipeline is presentation. This is where log data is queried and visualized through a user interface. Here, users make sense of the data and derive insights for various purposes.
Now that we have a better understanding of what a logging pipeline is, let’s take a look at the challenges associated with building a CDN logging pipeline.
4. Challenges with Building a CDN Logging Pipeline
Working with CDN logs comes with a unique set of challenges. The root of these challenges lies with the fact that CDNs emit massive amounts of log data. The deluge of logs makes data ingestion, querying, visualization, and storage tricky to manage.
4.1 The Scale of CDN Log Data
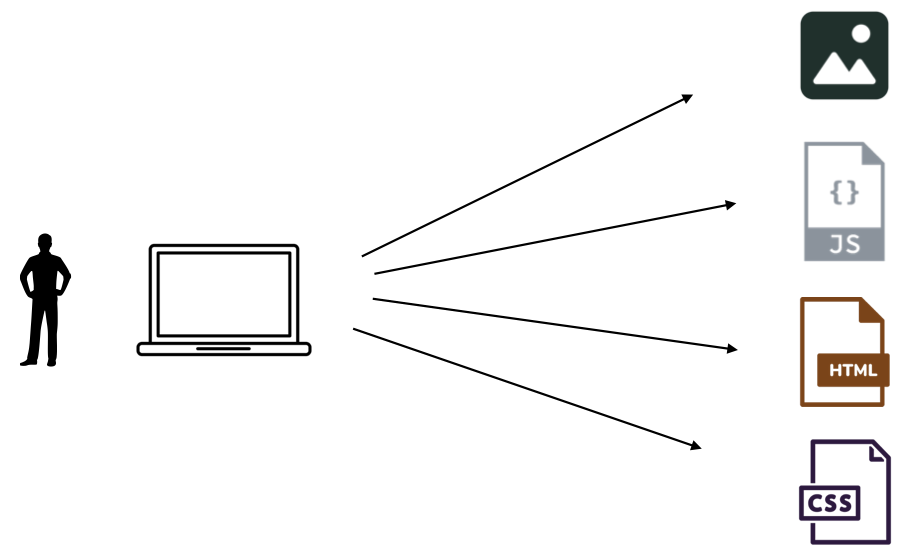
When a user opens a web page, the browser might issue many requests to the CDN. A single web page can consist of a variety of different assets, such as images, videos, and javascript files, and the web browser must issue requests for each of these resources.
Each of these requests will then hit the CDN layer. This means that traffic from a relatively small number of viewers can add up to a large number of requests at the CDN.
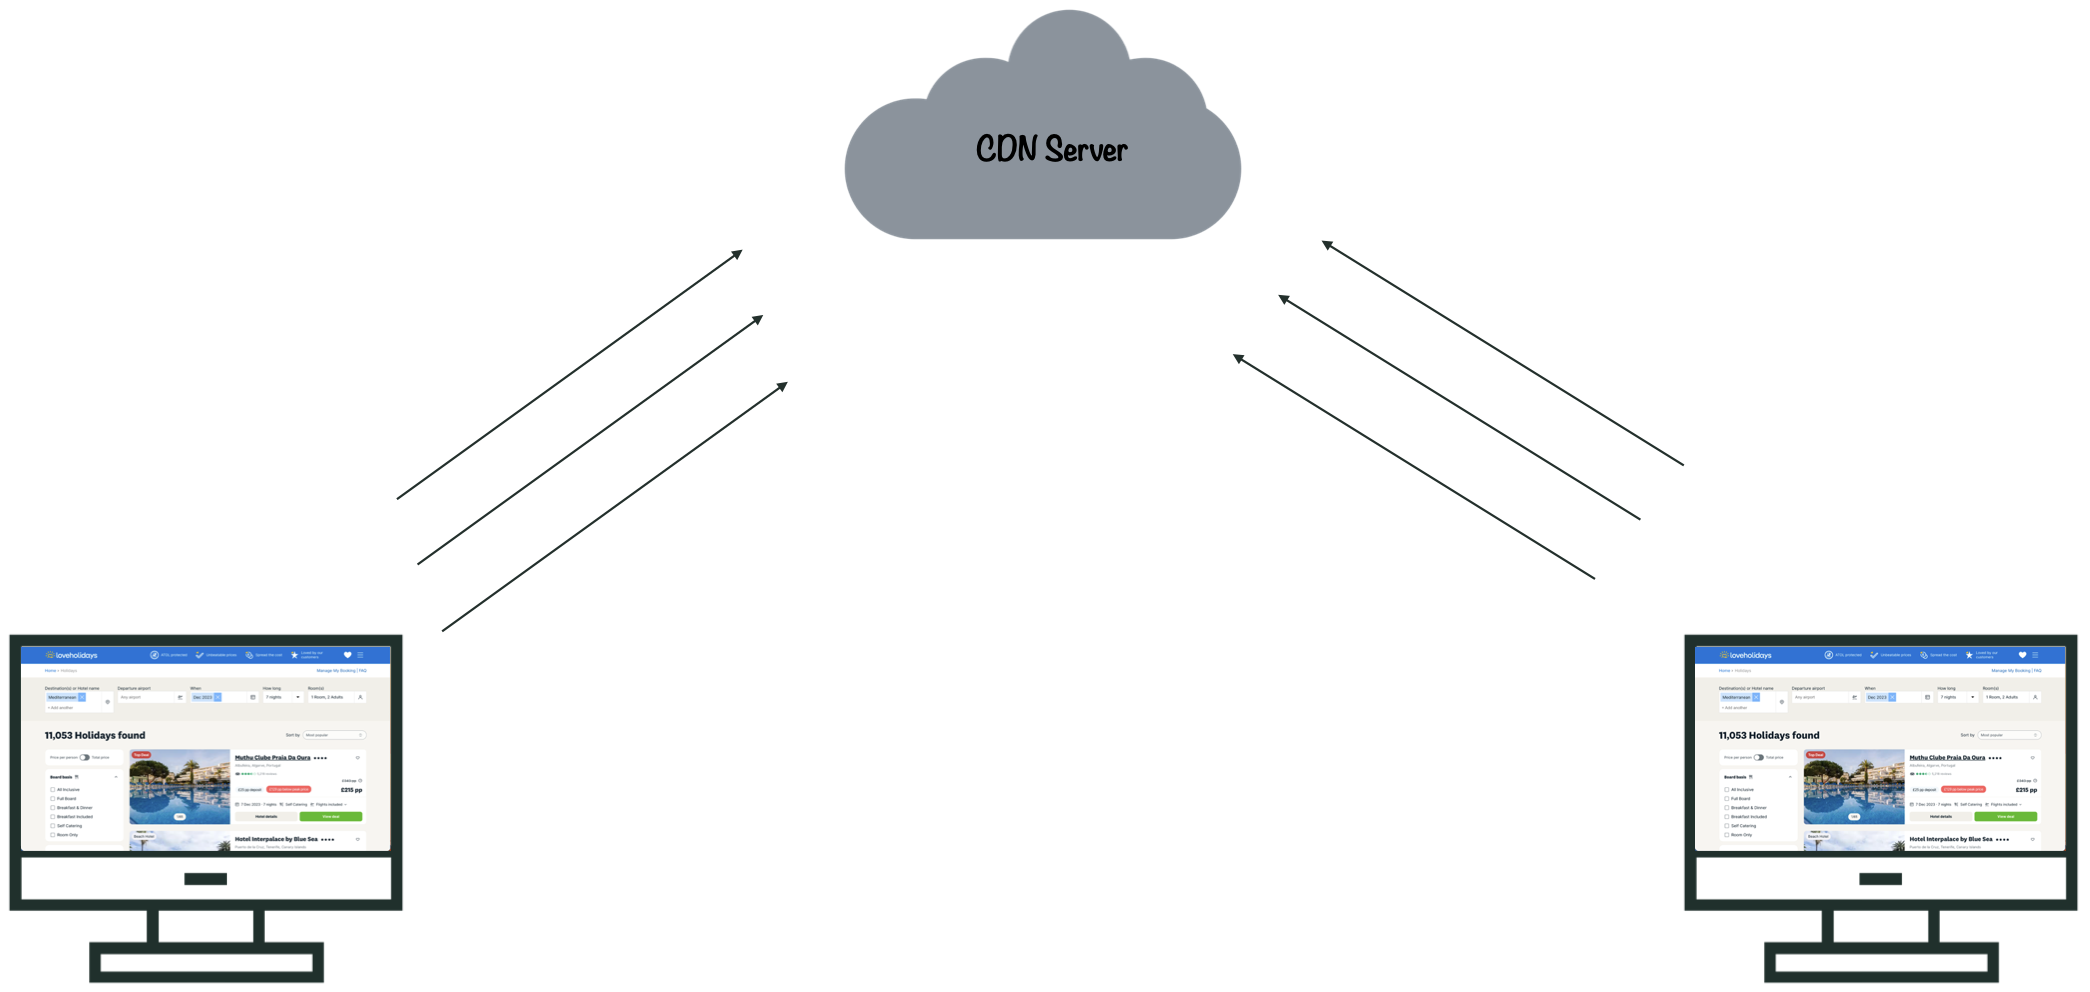
This means that even for small and medium sized companies, web traffic can result in millions or even billions of requests to the CDN, and an equivalent number of logs. This presents a challenge to engineering teams at these companies, who need to handle all this data.
LoveHolidays, an online travel agent, states in an article they published on upgrading their CDN monitoring solution that they process more than 30 gigabytes per day of CDN logs.[8] That is quite a lot for a medium-sized company to deal with for just one type of telemetry data for one component of their cloud architecture! Altinity, an enterprise database provider, used CDN telemetry as an example of a typical trillion row dataset. [1]
The effects of this data flow are felt at every stage of a logging pipeline, from data ingestion to storage and visualization. Let’s take a look at data ingestion, where the effects are felt first.
4.2 Ingesting Data from the CDN
Ingesting CDN log data into a pipeline can be challenging. Internet traffic tends to be bursty, similar to traffic at a major train station, which might be busy during rush hour, but nearly empty in the late evening.
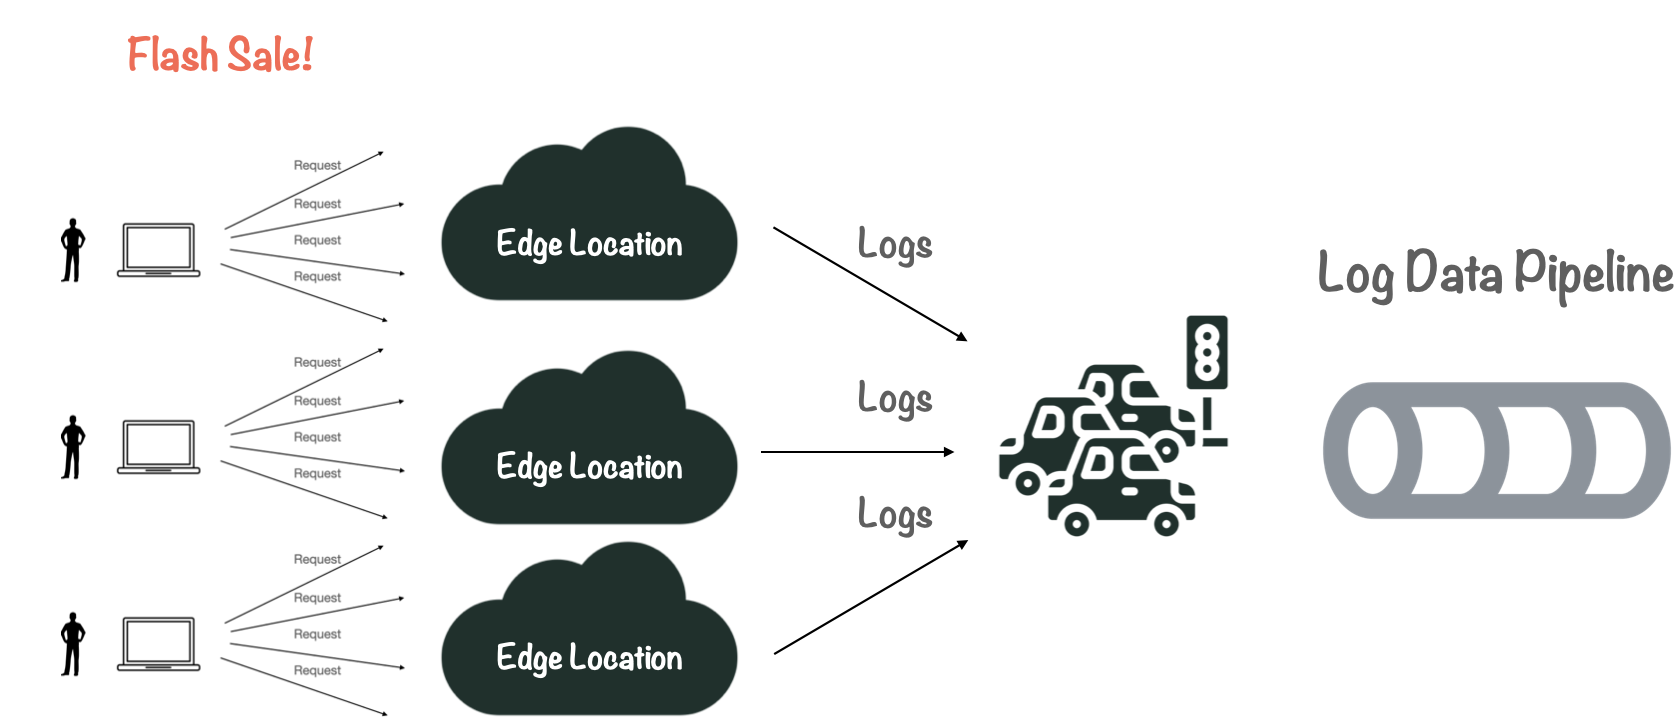
For the CDN, this means that user activity can fluctuate according to special events, such as flash sales or time of day, resulting in varying log output. The pipeline needs to be able to handle this varying flow without slowing down or backing up.
4.3 Querying and Visualizing CDN Log Data
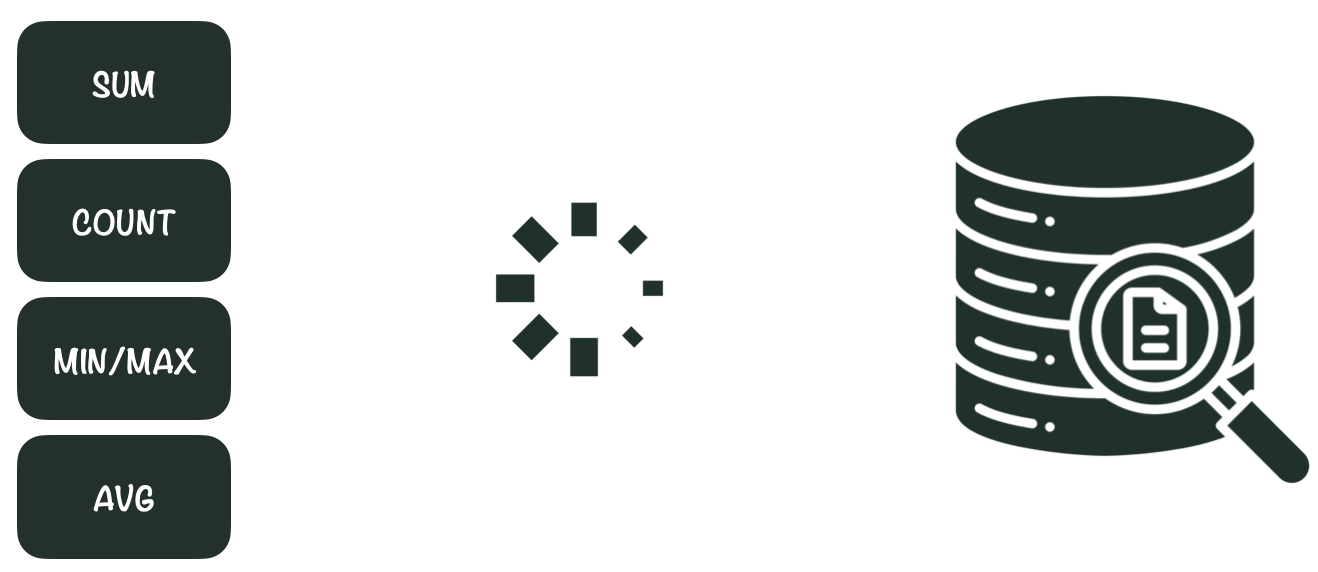
An equally important challenge is how to efficiently query and visualize CDN log data. Monitoring the CDN requires running analytic queries, like data aggregates, where we perform mathematical operations such as “sum” “count” “min/max” and “average” over a large portion of the dataset. This can be slow and expensive to run, especially with such large datasets.
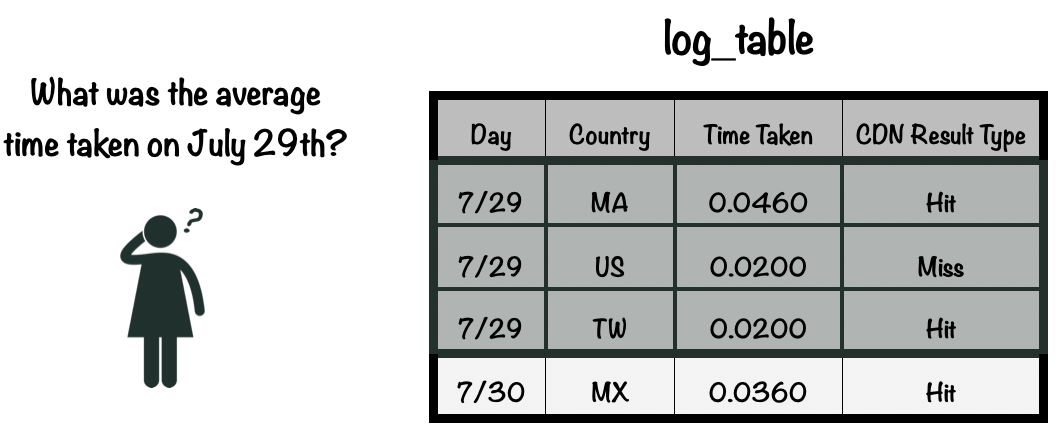
However, data aggregation is essential to deriving useful information from text-based log data. For example, examining the “time taken” field, (a measure of latency) for one log is rarely useful by itself. If we have many logs, it is much more useful to ask “what was the average time taken?” This data can then be visualized in a chart or graph.
While many databases support aggregate queries, not all would perform well with such large datasets. This can be slow and expensive to run, especially with such large datasets, and can be difficult to process in real-time. This poses a significant challenge for a real-time monitoring solution.
4.4 Storage Requirements
Aside from efficiently running analytic queries, a storage solution for CDN logs has three major requirements:
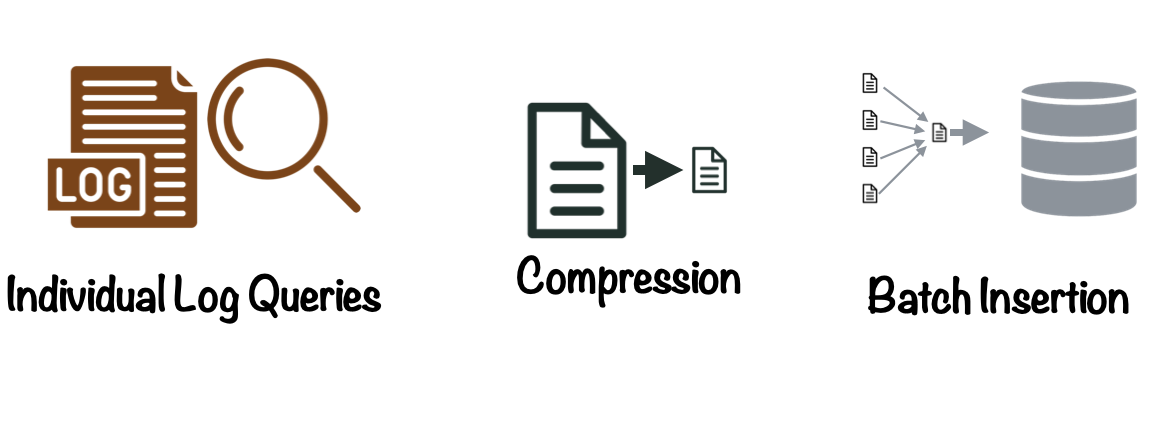
Retaining Individual Log Lines
First, it should ideally be able to store and retrieve every log line the CDN emits for debugging and compliance. If we only wanted to use CDN log data for data analysis, we might be able to reduce storage requirements by sampling the data set (or only storing a fraction of the log data emitted by the CDN).
However, if something goes wrong in a production system’s cloud architecture, the answer to what went wrong might lie in a single log line. In ApacheCon 2019, Geoff Genz gave a presentation describing the way Comcast stores CDN log data. He addressed this problem directly saying “We can't do just aggregates... we have to have the actual events. Because if somebody calls up and asks what happened with this client at this time, we need every single thing that happened”.[10]
Providing Efficient Compression
Because we need to store all this data, doing so efficiently becomes very important. The storage solution should therefore be able to efficiently compress and store log data. Reducing the required storage size for large CDN datasets can result in substantial benefits in terms of cost and maintainability.
A corollary is that databases storing CDN log data should not add large indexes to log data. Indexes are data structures that improve the speed of queries. Large indexes increase the storage requirements and generating the indexes eats up system resources. [11]
Supporting Quick Batch Insertions
Finally, because CDNs produce so much log data, our storage solution needs to be able to quickly ingest large quantities of log data. Working with large batches has advantages over streaming individual log lines to the database. Working with batches means that log data can be shipped to the database using fewer requests, saving network bandwidth and making retries easier to manage in the event the database is unavailable.
In summary, the large volume of logs emitted by CDNs presents challenges at every stage of a logging pipeline, from data ingestion to storage and visualization. However, these technical challenges are not the only considerations teams need to keep in mind when choosing a monitoring solution. Different solutions offer different tradeoffs that we need to consider.
5. Existing Solutions
Companies interested in monitoring their AWS CloudFront CDN distributions have three main choices: they can use AWS’ ‘native’ monitoring tools, a third-party (SaaS) solution, or they can build their own DIY solution using open source tools. These choices have different advantages and tradeoffs.
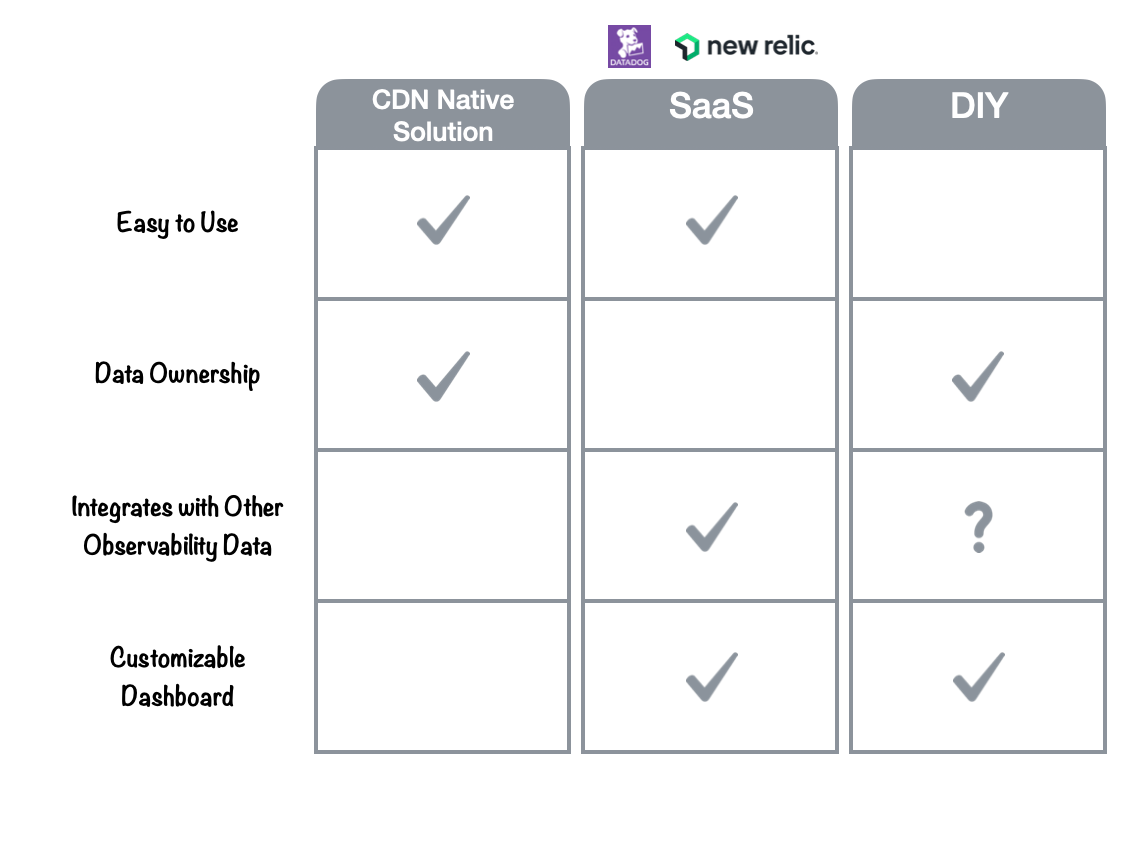
5.1 AWS ‘Native’ Monitoring Tools
The first and easiest choice would be to use the CDN’s “native solution”. For CloudFront, this would be the included Reports and Analytics page. CDN native solutions are easy to use and don’t require teams to send data to a third party, but don’t easily integrate with other observability data, and in Amazon’s case, don’t offer customizable dashboards.
Note: AWS also offers AWS CloudWatch, a fully-featured monitoring solution that can be used to visualize CloudFront logs and metrics, however its cost is on par with third-party SaaS providers, discussed below, and is no easier to use with CloudFront real-time logs than other SaaS solutions, as the logs must be shipped to CloudWatch manually.
5.2 Third-Party (SaaS)
An appealing option for many teams would be to use a third-party SaaS (“Software as a Service”) solution, such as Datadog or New Relic.
SaaS solutions have several advantages. They are easy to use, integrate with other observability data, and feature customizable dashboards. They also manage the logging pipeline for you, relieving the developer from concerns about deploying, scaling, or maintaining pipeline infrastructure.
However, SaaS solutions are not ideal for teams that have strict data ownership requirements. Teams handling sensitive data or operating in regulated industries must consider data privacy and compliance requirements. They would have to give up control over their log data and infrastructure to a third-party, including the ability to decide how and where the logs are stored and processed. Third-party vendors can also be expensive.
5.3 DIY
Finally, teams looking to monitor the CDN can choose to build a custom DIY solution.
A main advantage of DIY solutions is data ownership. DIY solutions allow development teams to retain complete control over their data: who accesses it, where it’s stored, and how long to store it. It also means the flexibility to customize the pipeline according to their specific requirements.
The downside to this approach is the labor required to build it. Building a solution could take weeks or months depending on the complexity of the project and available developer time.
5.4 Another Option?
For some teams, both SaaS solutions and the AWS native solutions may not work for their specific use case. However, they may also not want to devote substantial developer time to building a DIY solution. This is where Canopy fits in.
6. Introducing Canopy
Canopy’s design incorporates the ease of use of a third-party SaaS solution with the data ownership and control associated with a DIY approach.
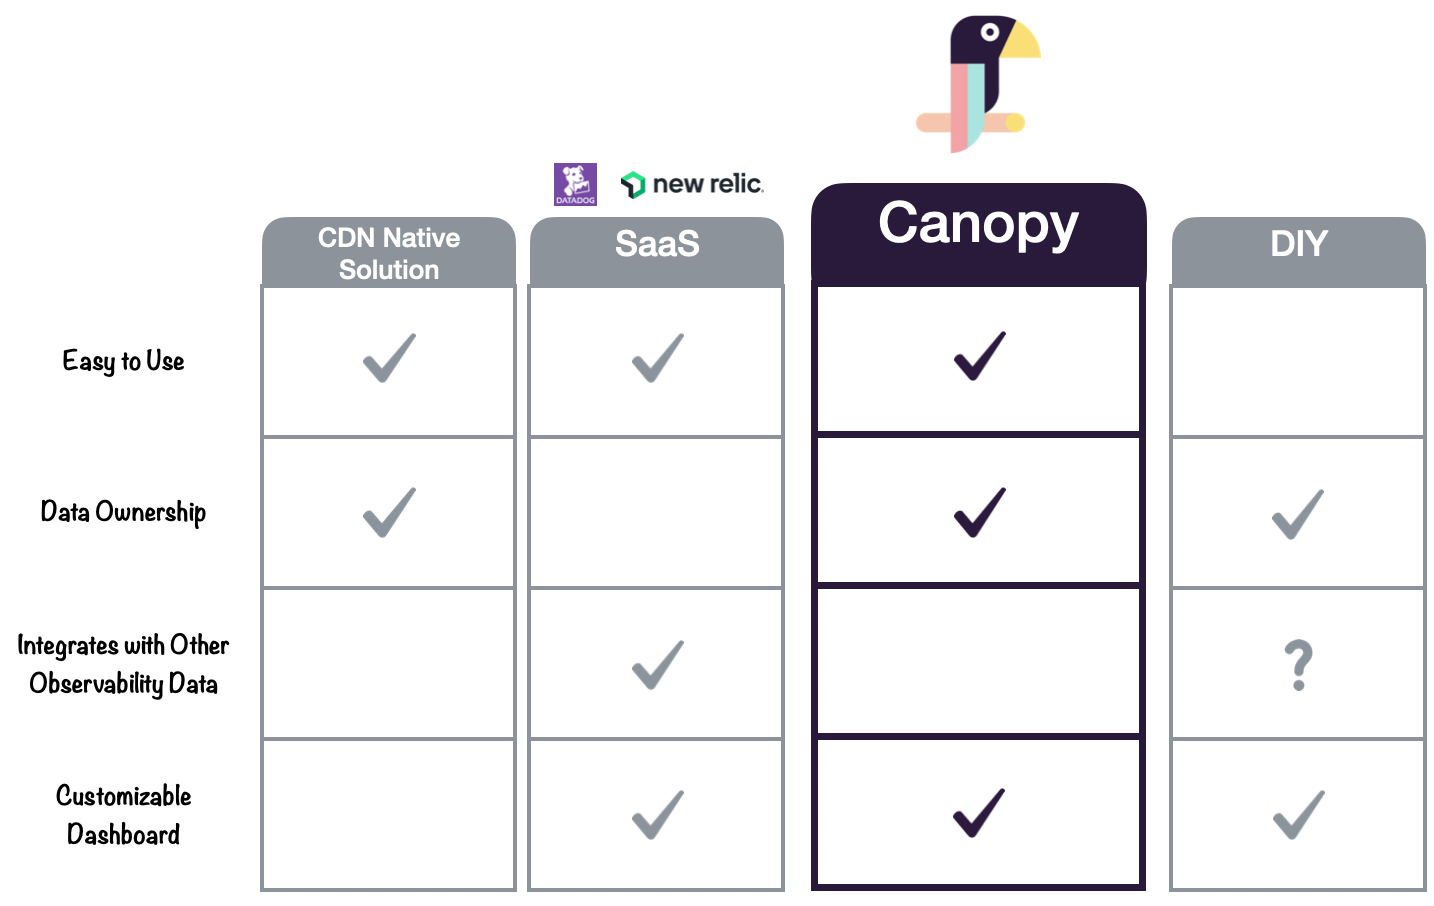
Canopy’s architecture is built using open-source components that are configured within the team’s own AWS account, allowing them full control of their data. Canopy also features customizable, real-time dashboards and fully-automated deployment.
However, Canopy lacks certain features offered by platforms like DataDog or a fully customized DIY solution. For example Canopy does not support integrating CDN log data with other observability data.
Let’s explore how to use Canopy for your team’s monitoring needs.
7. Using Canopy
7.1 Installing and Deploying the Canopy Pipeline
Canopy is designed to be easy to use and require minimal configuration. The Canopy logging pipeline can be deployed to AWS in one command using “canopy deploy”. Detailed installation and configuration information can be found on our Github page.
7.2 Monitoring CDN Log Data
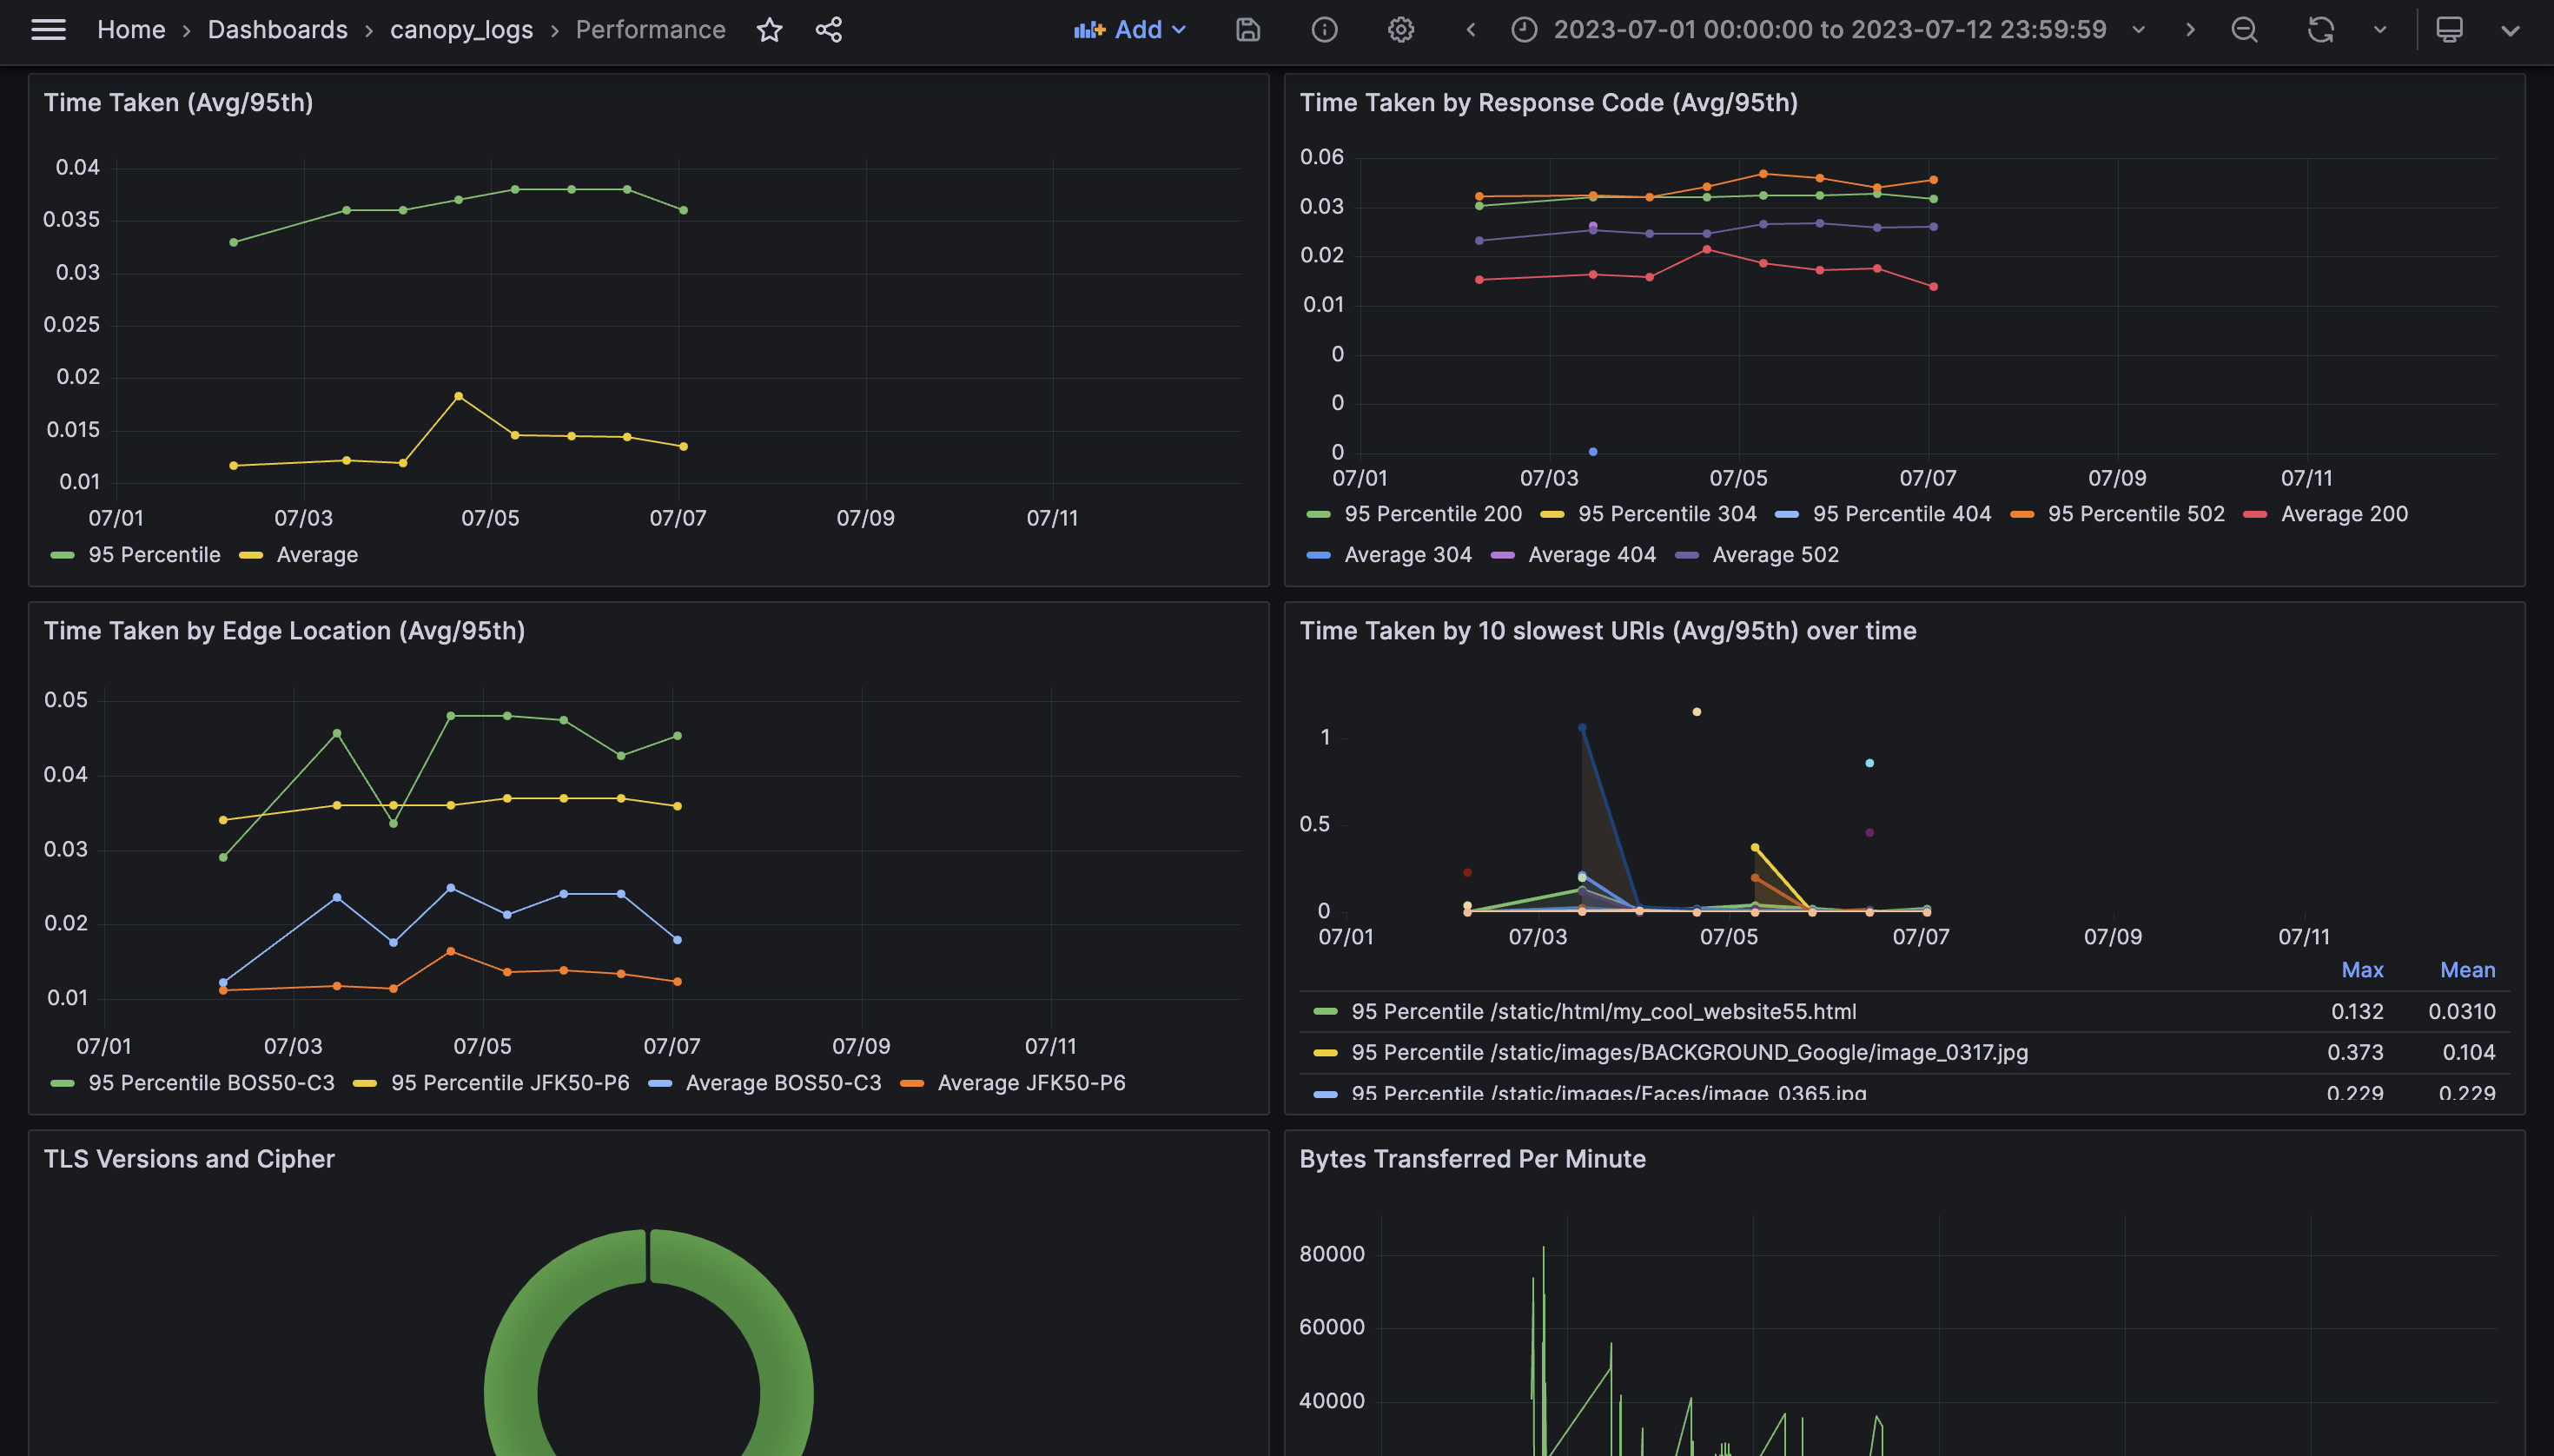
Canopy provides a custom set of Grafana-powered real-time dashboards divided into three tabs: CDN Logs Overview, Client Information, and Performance. They include metrics and visualizations corresponding to the four golden signals.
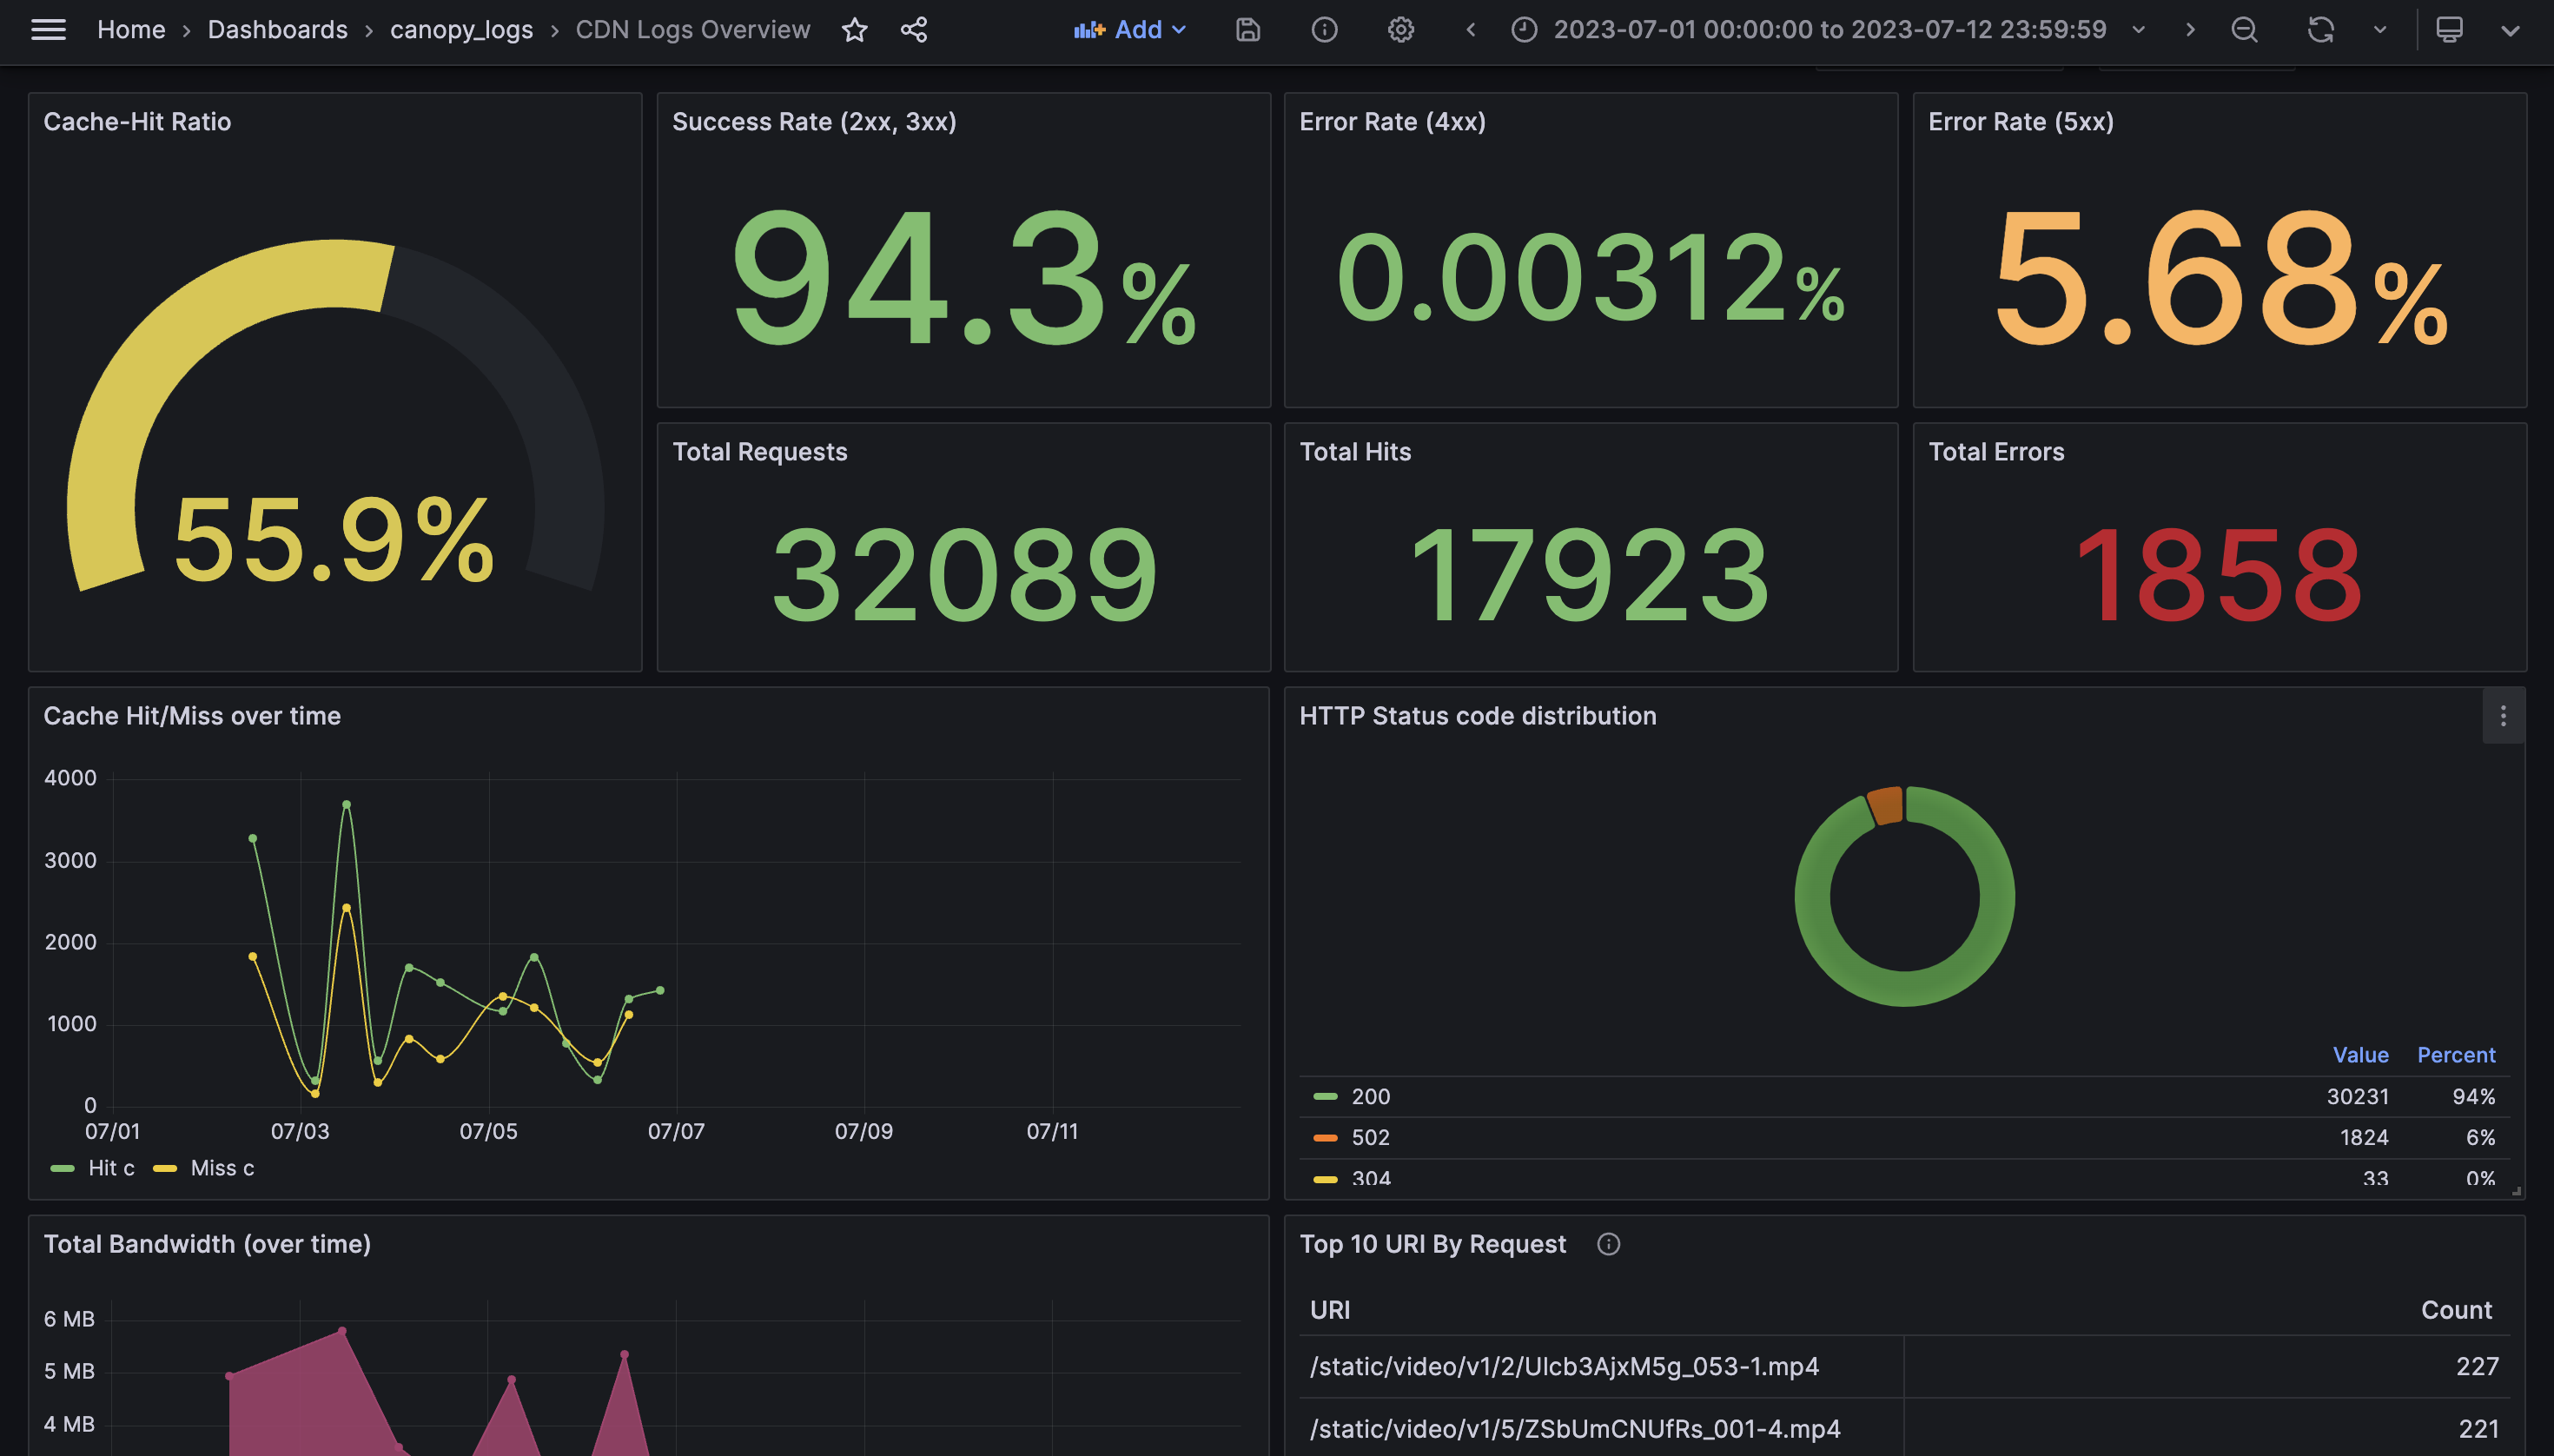
This image shows the “CDN logs overview” dashboard, which is the main landing page for our users to monitor their CloudFront distributions. Here, we present traffic and error metrics, allowing users to quickly assess the health of their CDN traffic. The top row shows the overall cache hit ratio as well as information related to errors and total requests.
There are 2 other Grafana dashboards.
The Client Information tab presents traffic metrics, specifically related to the client.
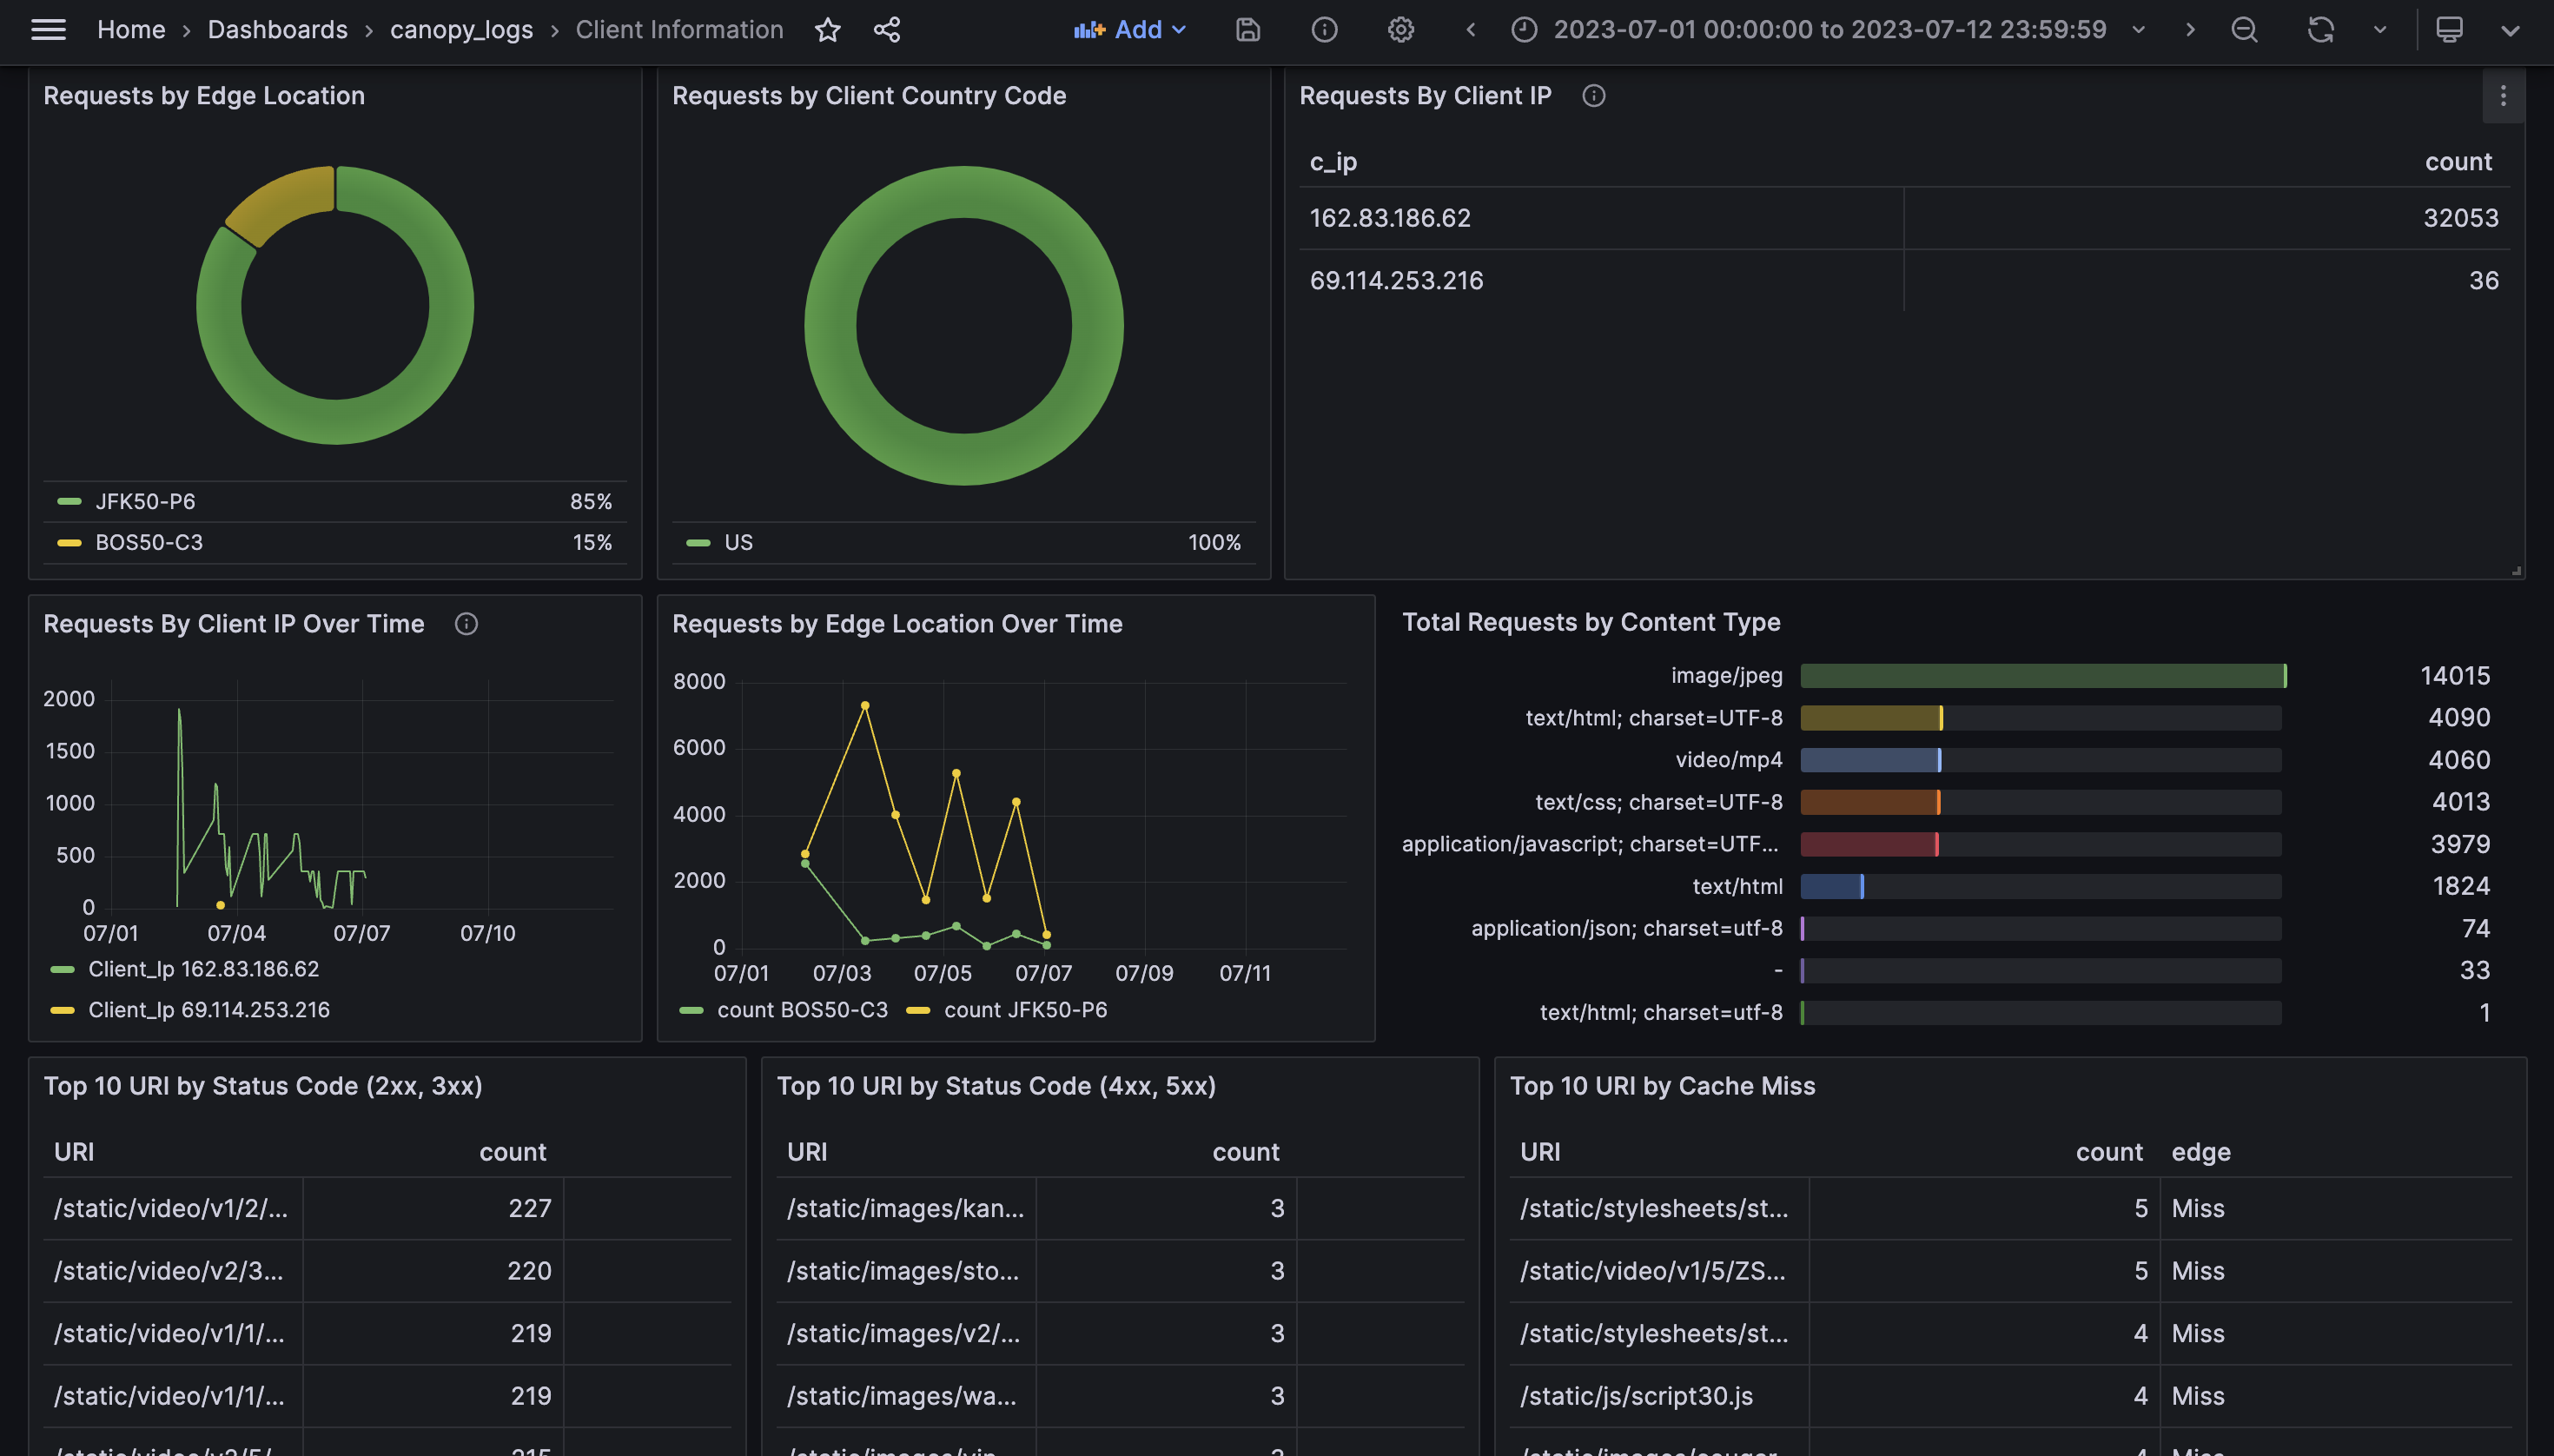
The Performance tab presents latency and saturation metrics.
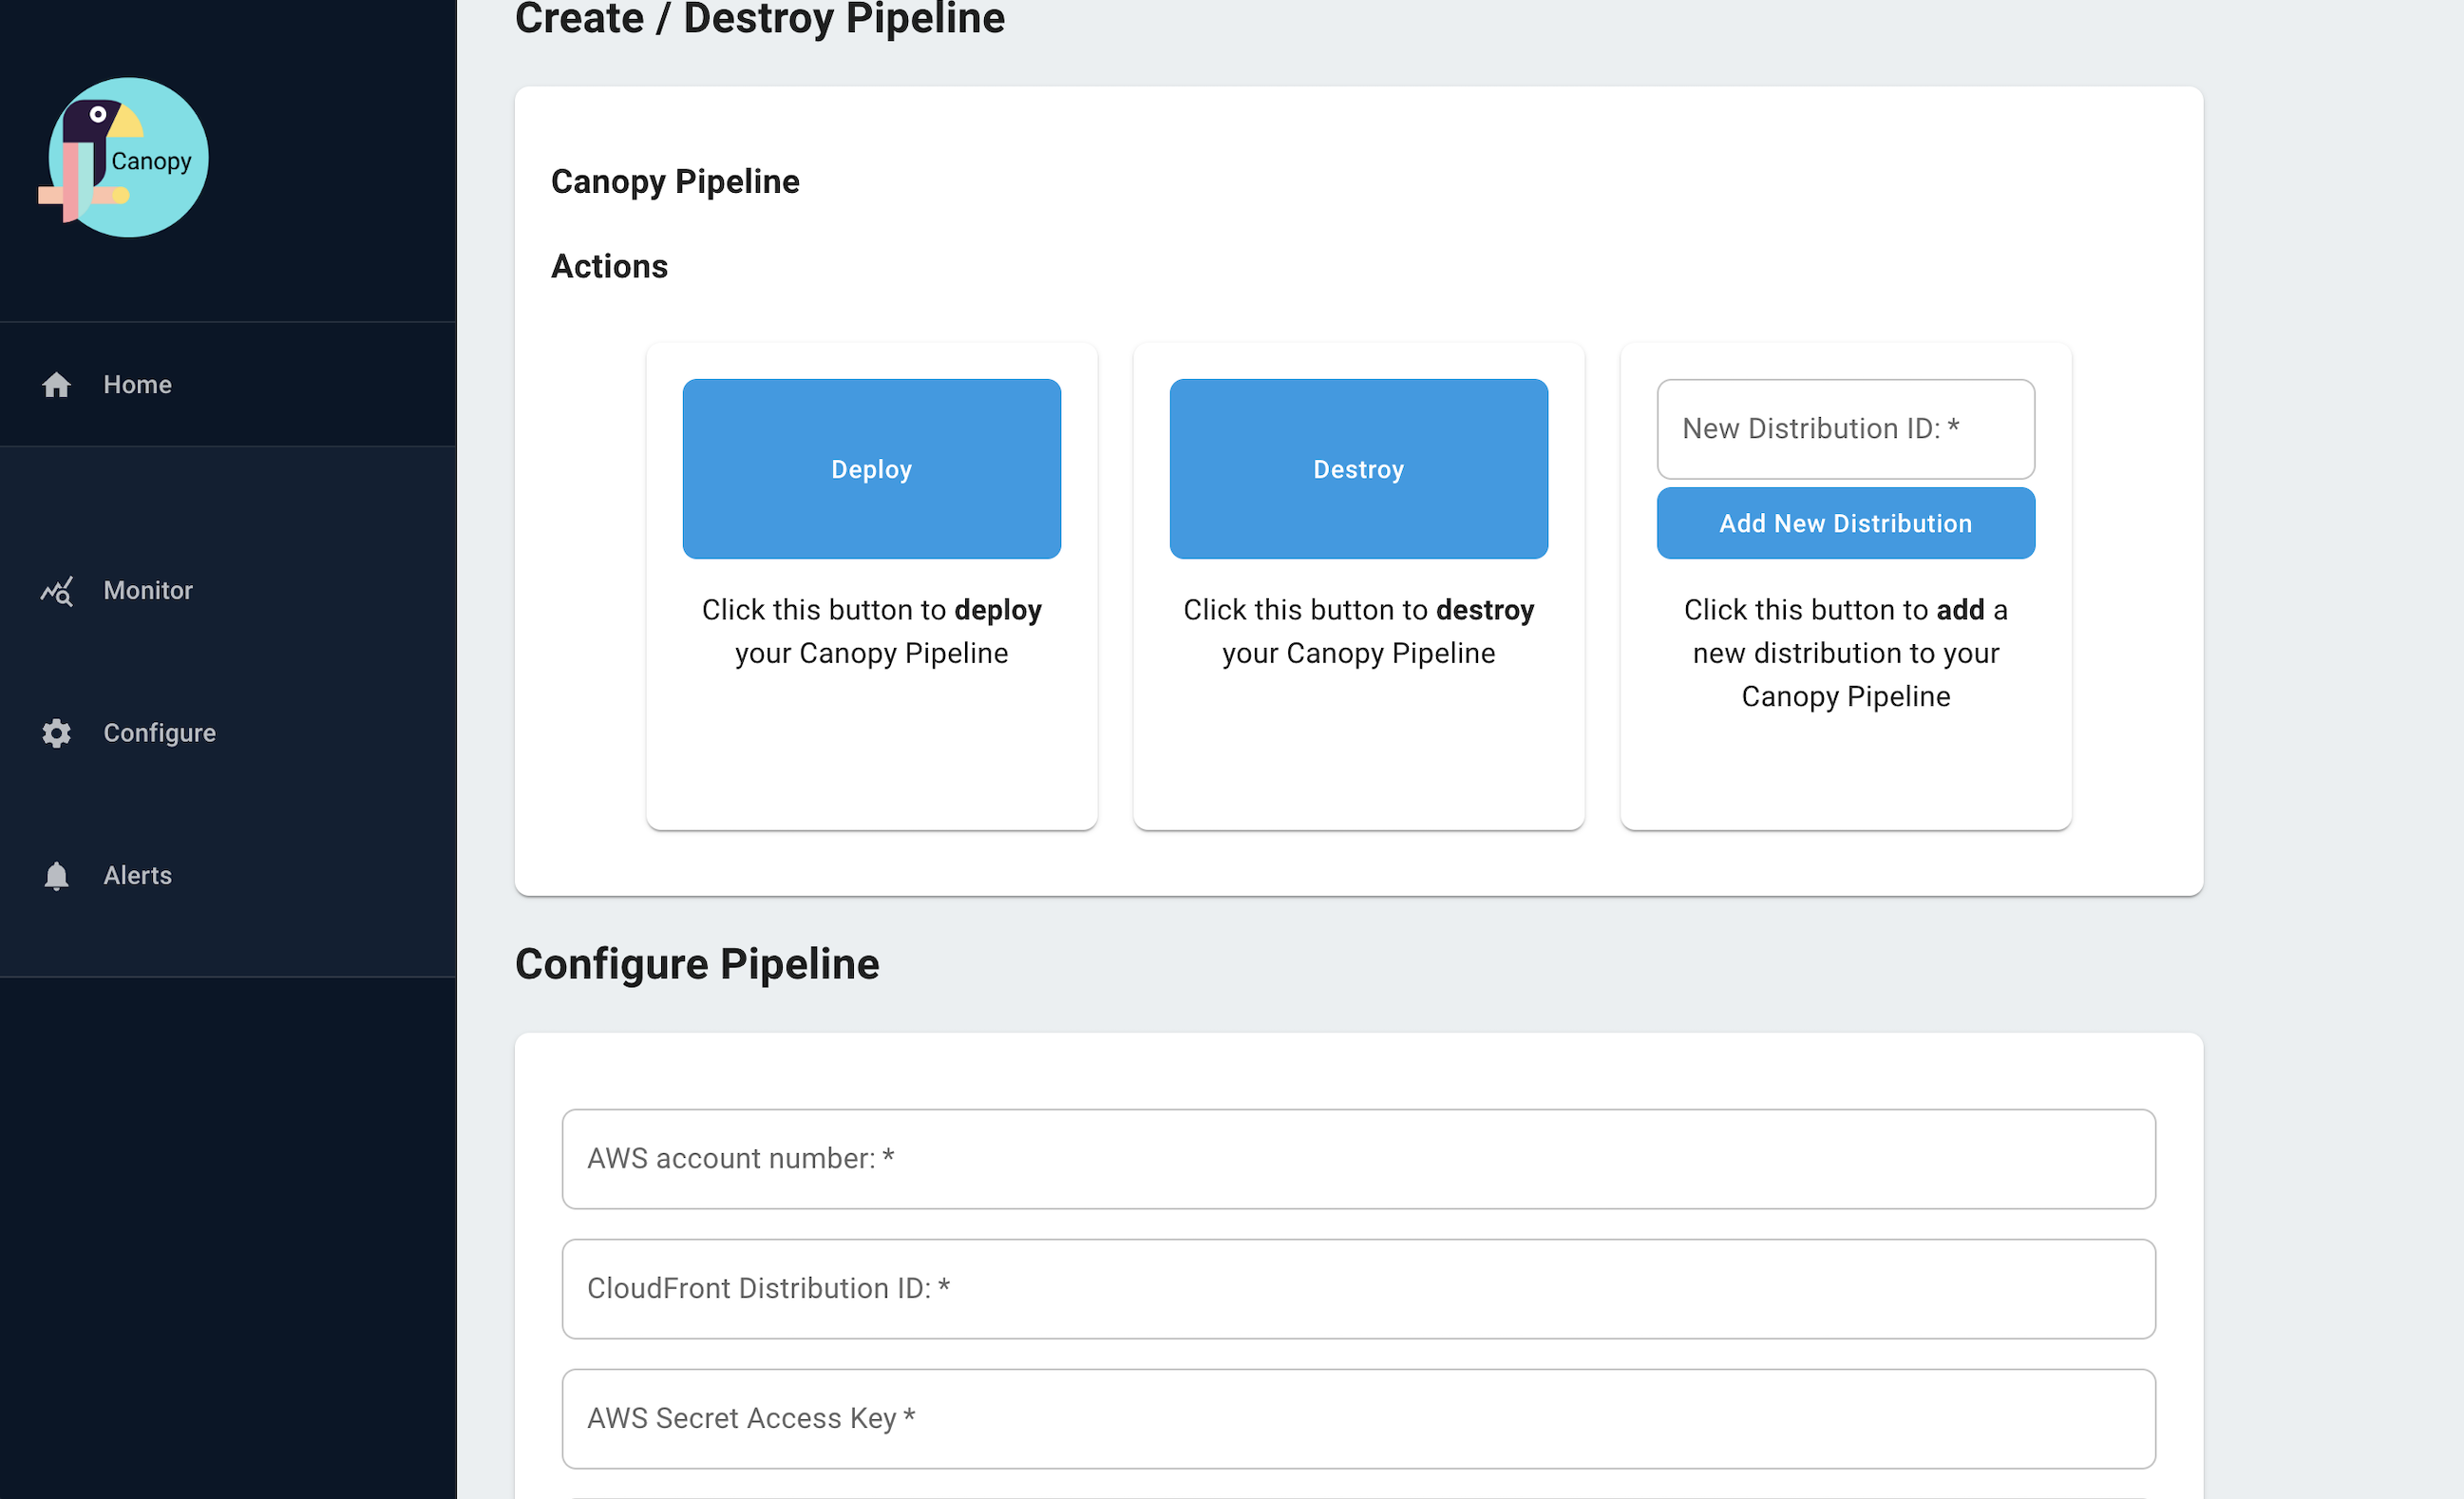
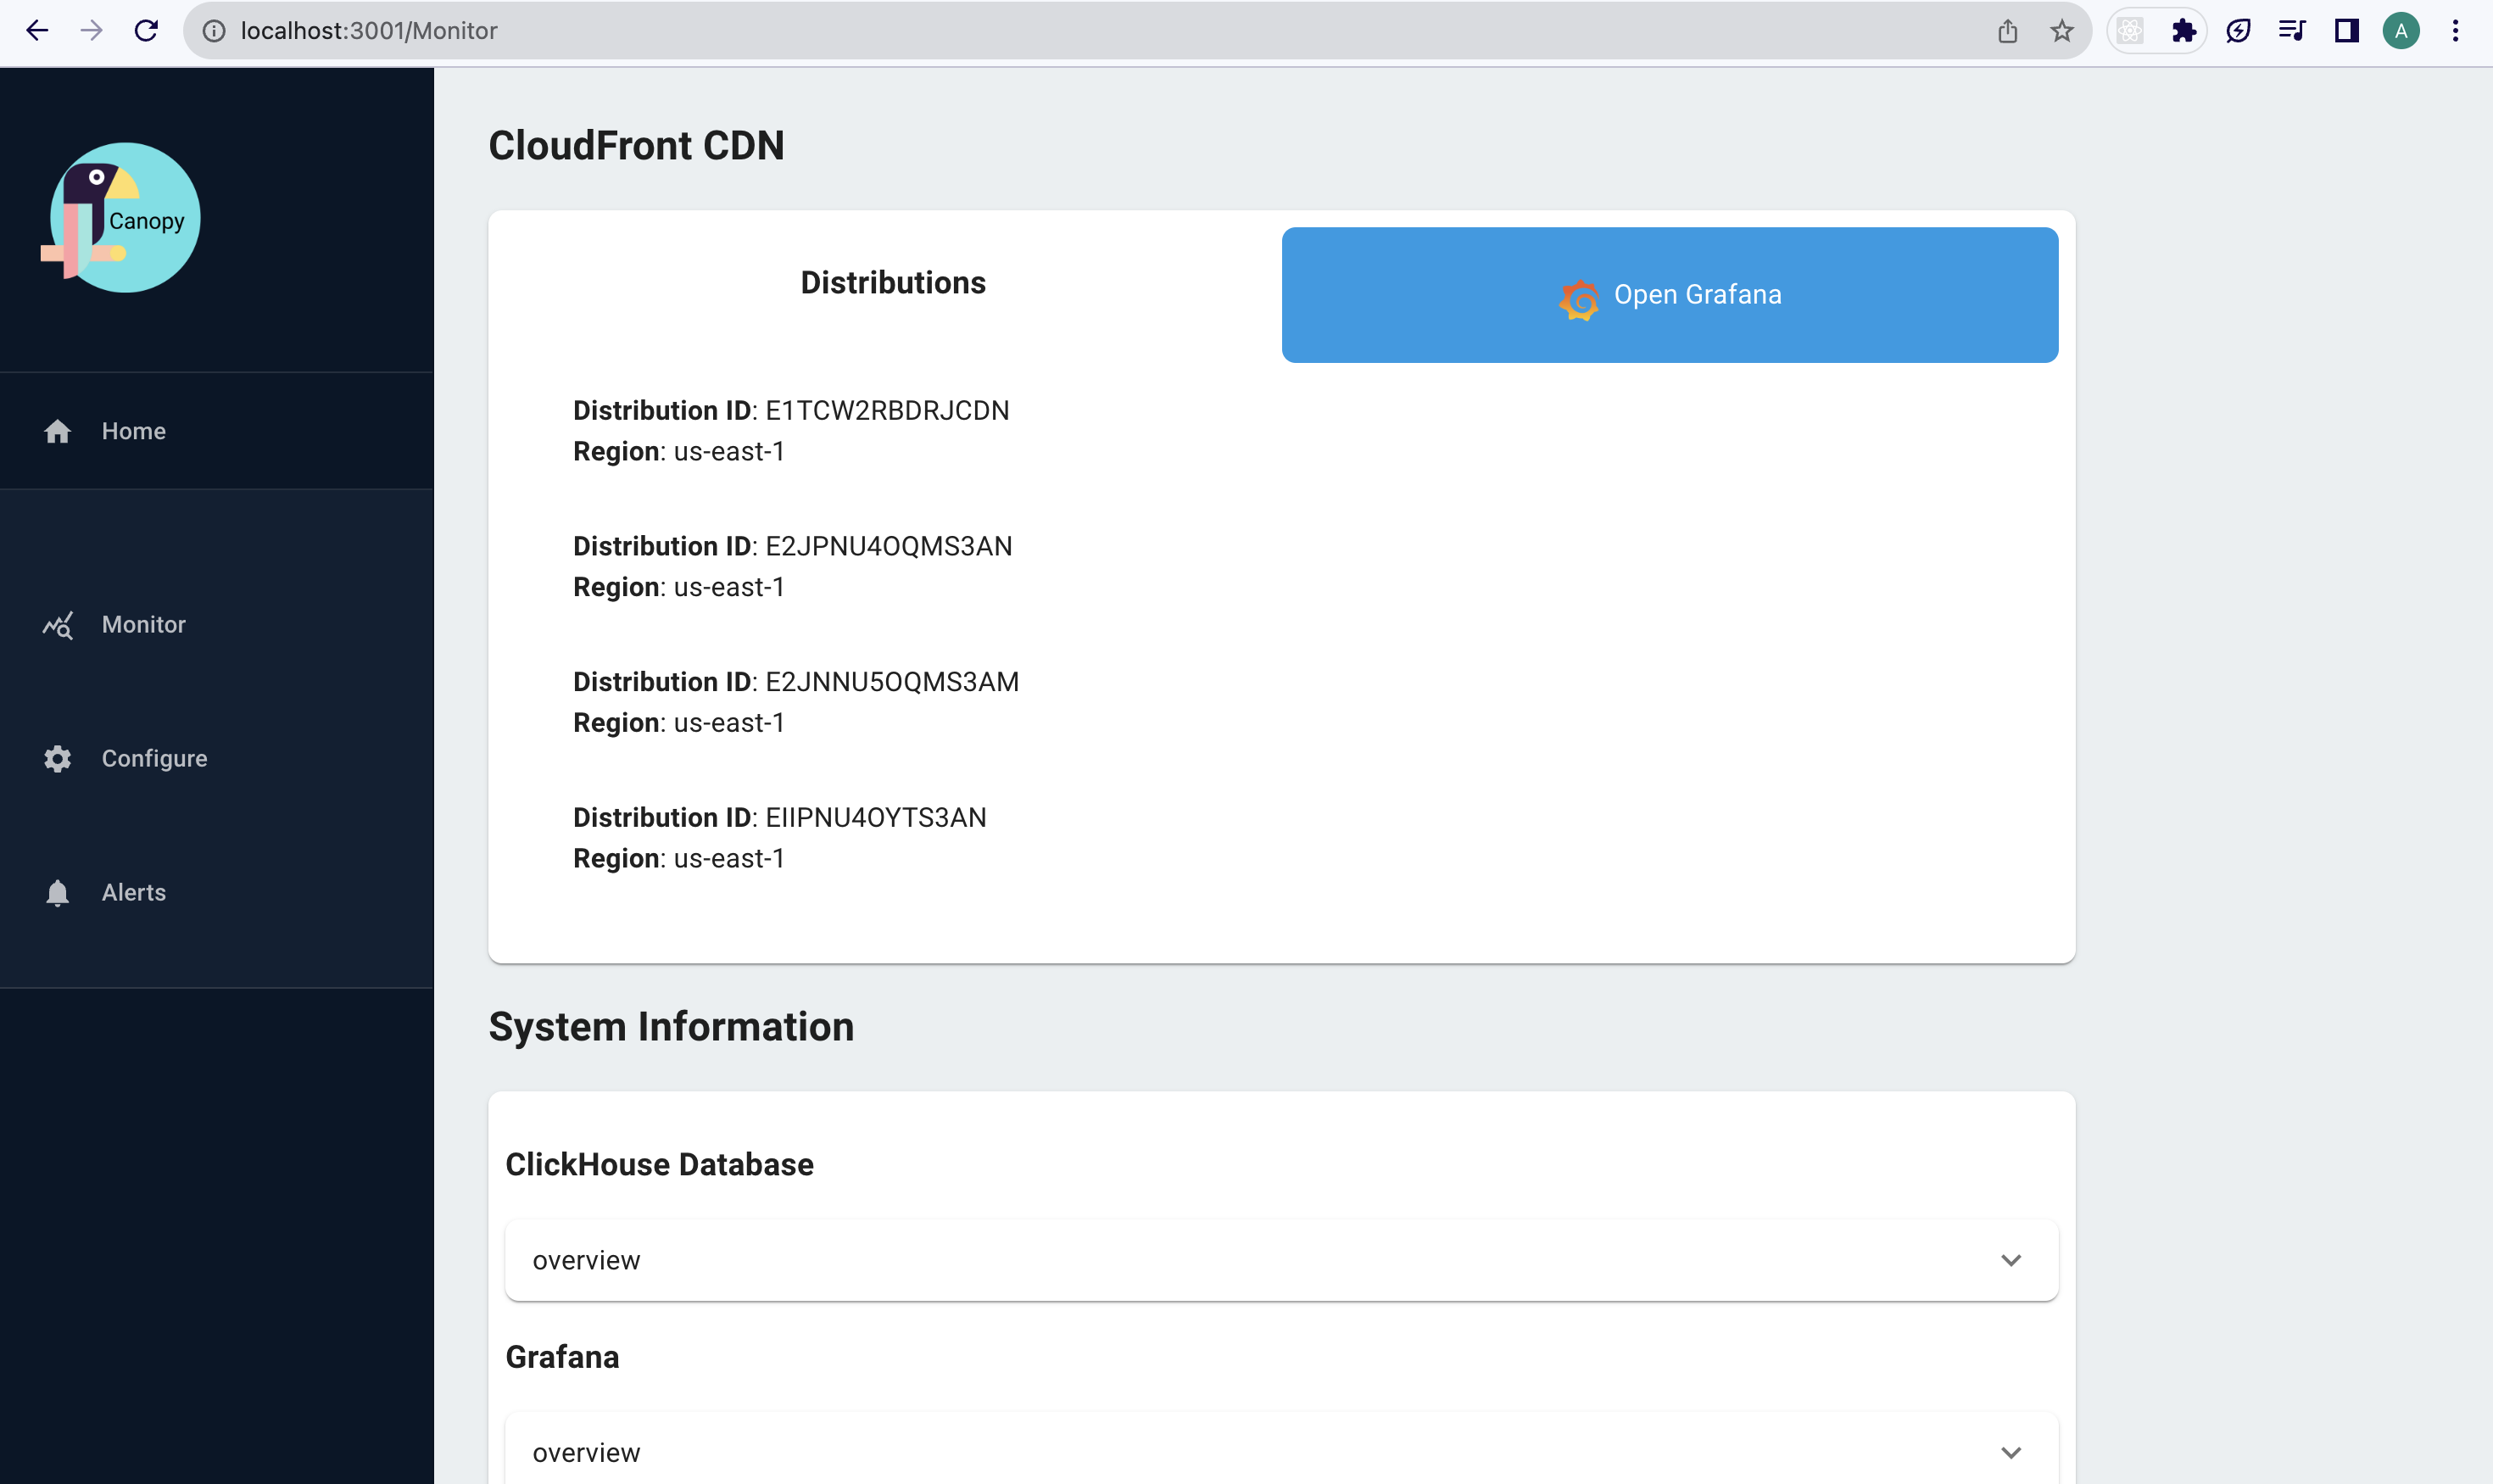
Admin Dashboard
Canopy also has an Admin dashboard, displayed here. From the Admin Dashboard, users can conveniently deploy and configure pipeline infrastructure as well as monitor the status of pipeline architecture after it has been deployed.
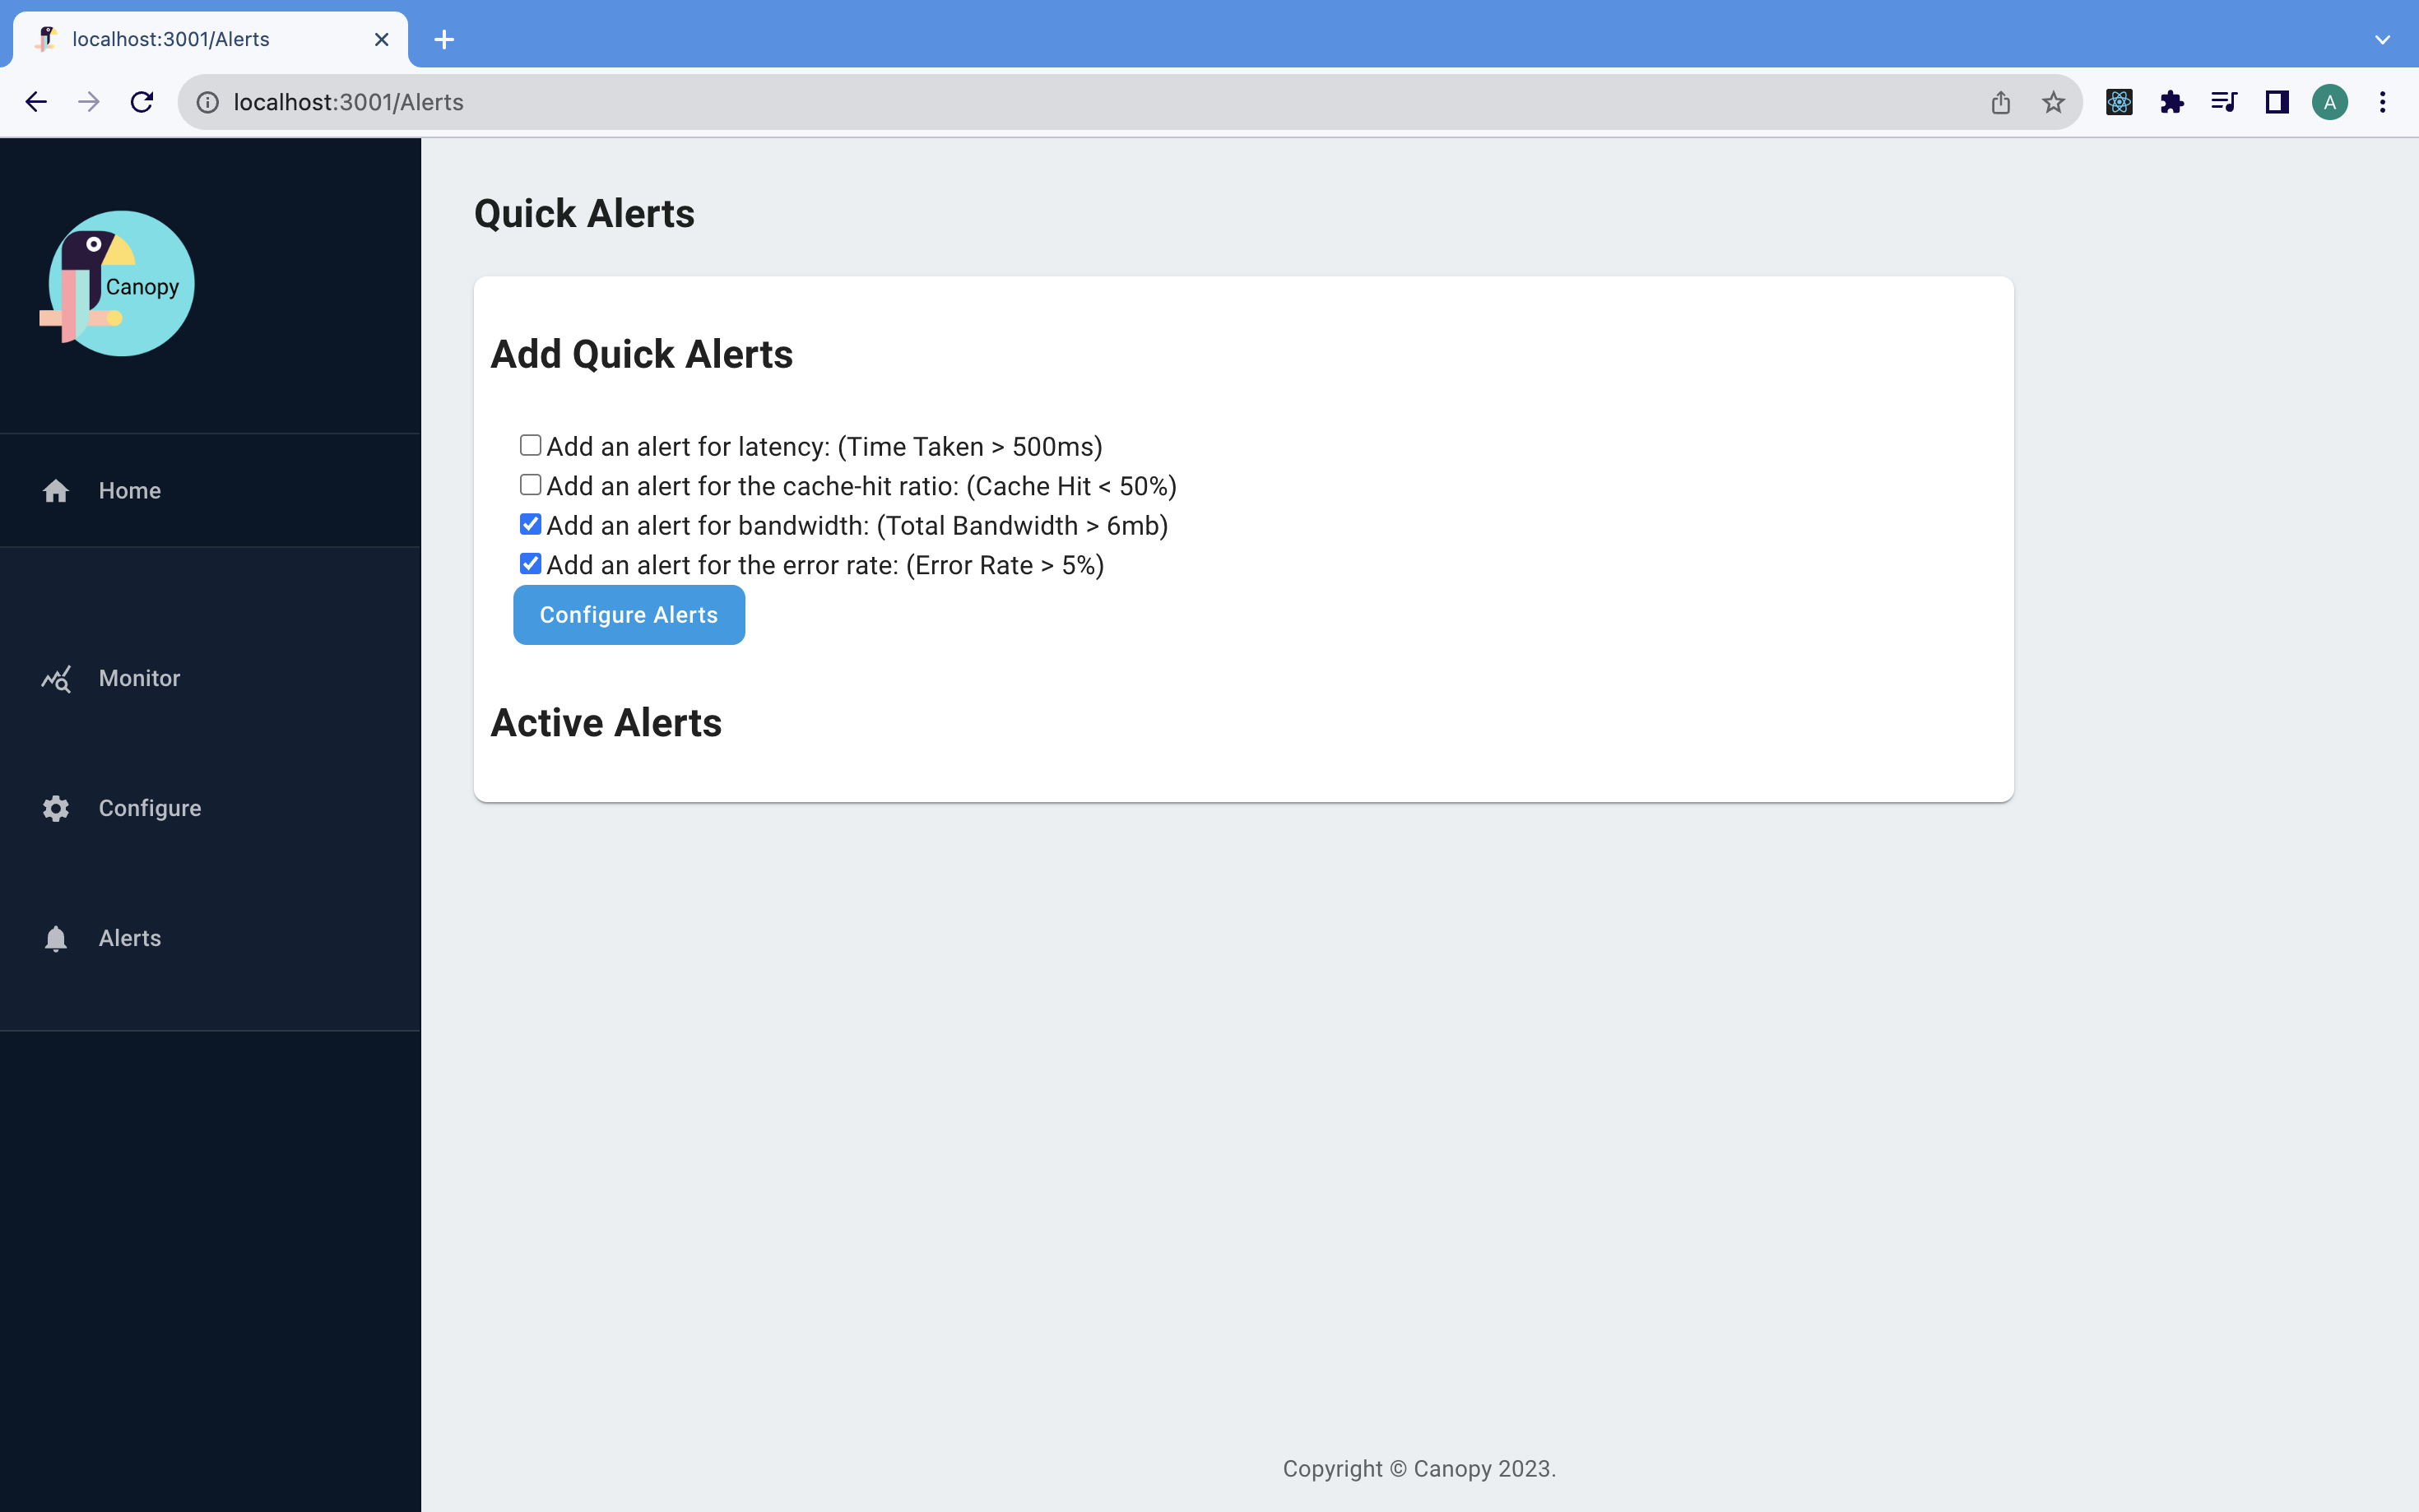
From the Admin Dashboard, teams can also configure “quick alerts” with the click of a button. Quick alerts send email notifications to teams when certain thresholds are met, corresponding to the golden signals.
In the upcoming sections, we will discuss the challenges and engineering considerations that went into building Canopy’s pipeline architecture and examine the evolution of that architecture from an initial prototype to its current form.
8. Architecture Overview
Building Canopy was a multi-step process. Through several iterations, we took Canopy from an idea to a fully automated real-time logging pipeline. We began by identifying the core requirements for our project and then proceeded to build an initial prototype.
8.1 Core Pipeline Architecture
From the model for Telemetry Pipelines described earlier, we knew that we needed an emitting stage, a shipping stage and a presentation stage. When we set out to build Canopy, we started by mapping out the core components we needed for each stage of its pipeline.
During the emitting stage, the CDN emits a continuous flow of logs as users make requests to the CDN.
The shipping stage consists of 3 steps: collection, transformation and storage. For collection, a stream collects and stores logs in real-time as they flow from the CDN. For transformation, the log transformer transforms those logs to a format appropriate for storage. For storage, the log shipper buffers and batches the transformed logs, and inserts and stores the log data into the database.
During the presentation stage, the visualizer queries the data stored in the database and visualizes the results in charts, graphs and tables in real-time.
After pinpointing the core components required for Canopy, the next step we undertook was building a working prototype based off of this architecture. In the following section, we discuss the challenges we encountered during development and how we addressed and resolved them.
9. Fundamental Challenges
9.1 Data Storage
Selecting a storage solution for CDN logs proved to be one of the most difficult decisions we had to make. We explored various possibilities, including Elasticsearch, time-series databases and columnar databases.

Our use case had unique requirements due to the nature of CDN log data. Our database should be able to handle large amounts of CDN logs at scale without sampling and efficiently handle data aggregates. Therefore, we needed to consider the level of indexing to minimize storage for preventing sampling. We also needed to consider the type of queries that each database optimizes for.
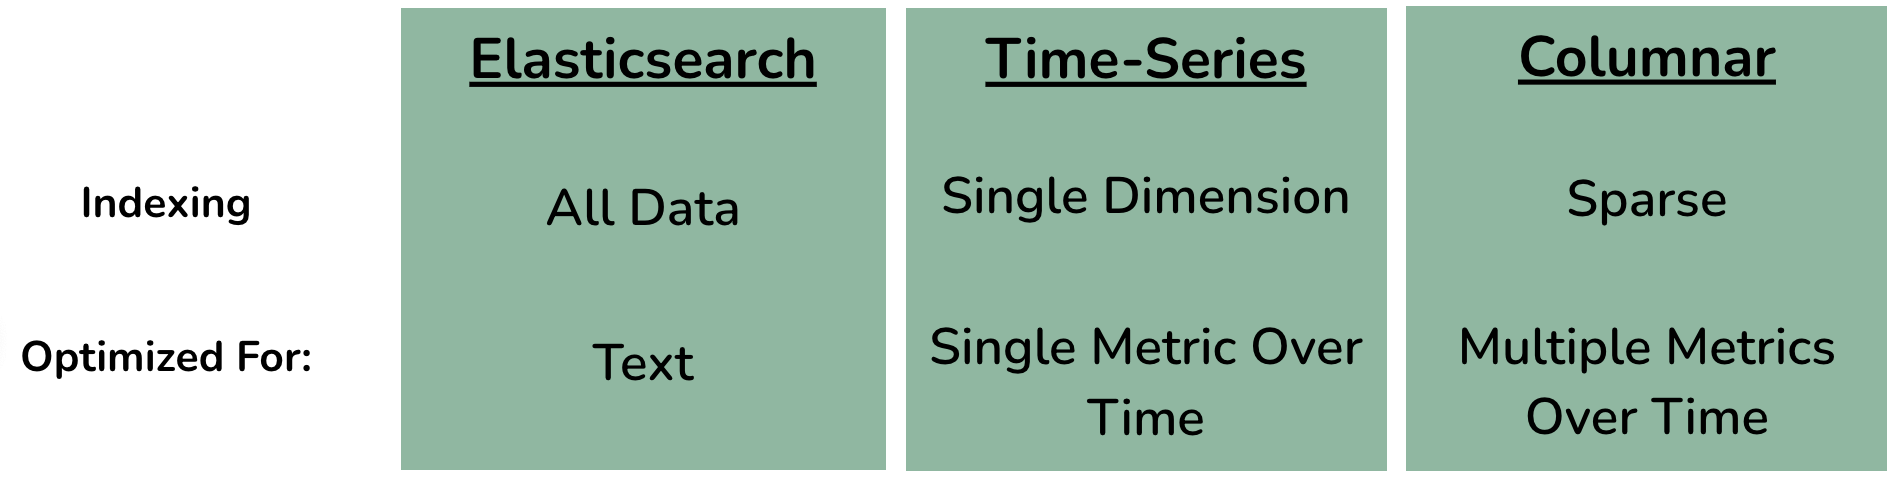
Elasticsearch, a popular search engine and database for log analysis, indexes the full contents of stored documents, thus making it great for full-text search.
We also considered time-series databases, since several of our metrics analyze changes over time. Time-series databases index data over a single dimension - time - making them efficient for running simple queries, such as aggregating a single metric over time.
Final Verdict: Columnar Database
Ultimately, we decided on a columnar database, more specifically ClickHouse. ClickHouse offered sparse indexing and efficient compression for reducing storage. It also offered a column-oriented approach to processing data. This approach optimizes for our use case’s more complex queries that aggregate several metrics over multiple dimensions. This includes examples such as URI by HTTP status code and requests by IP address.
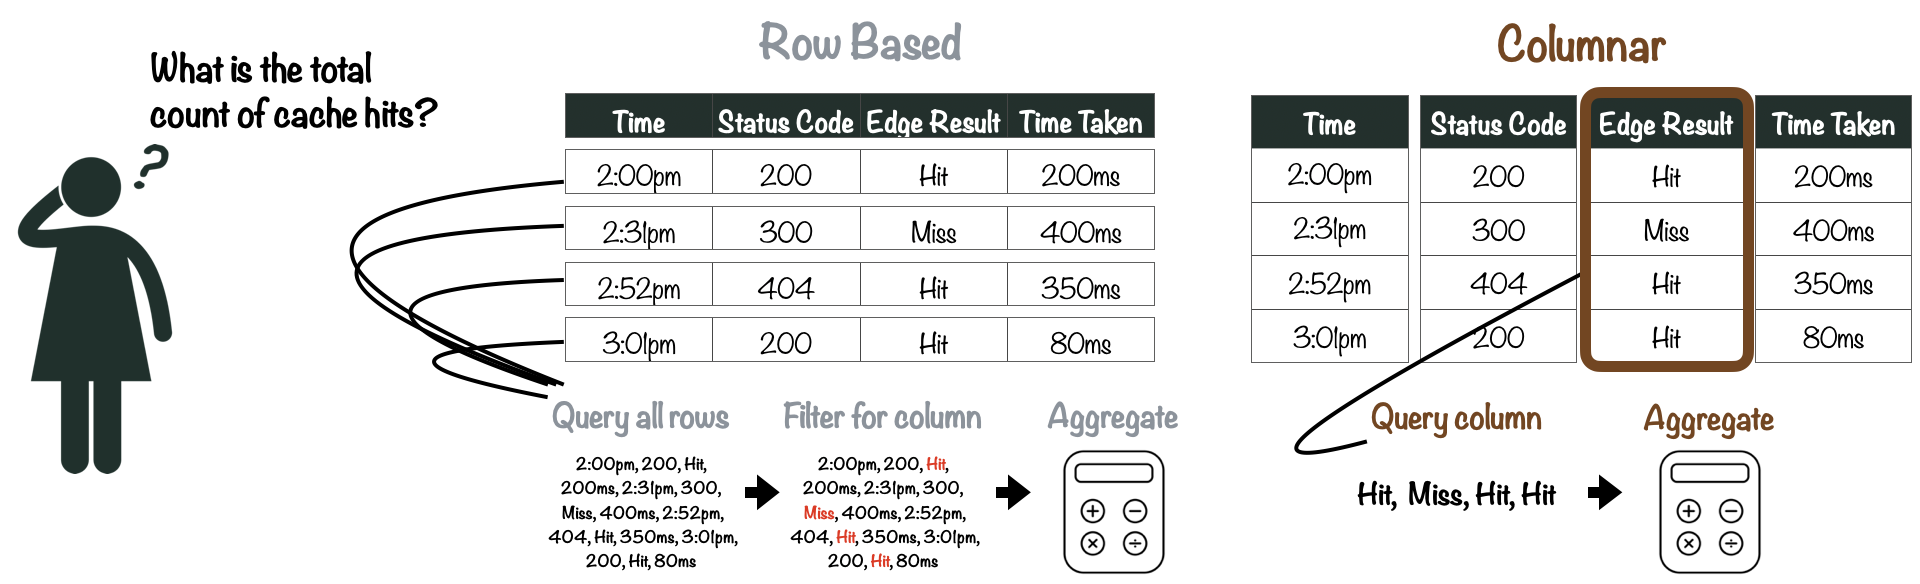
The vast majority of the queries we planned to make to the database follow a pattern: they use a fairly large number of rows in the database, but only a small subset of columns.
A columnar database stores data in columns, as opposed to rows. Its power lies in the ability to access a column of data and collapse it into a calculated result. This facilitates faster aggregation of data because the database only reads the necessary columns and omits the ones not needed for the query. CDN logs tend to form large datasets, and a columnar database can consolidate a high volume of data from a small subset of columns without the need to search entire rows of a table.
ClickHouse also uses sparse indexes. In ClickHouse, the values for each column are stored in separate files and sorted by a primary index. In Canopy’s case, we use timestamp as the primary index. ClickHouse indexes by default do not assign a unique value for each row, but rather, assign a unique value to a medium-sized batch of data, which can then be retrieved efficiently. Sparse indexes minimize storage needs and work well with batch insertions, which is well-suited to our use case.
While sparse indexes are less suitable for queries that fetch individual rows, our use case focuses primarily on aggregates. Furthermore, using timestamp as a primary key and sparse index still allows for acceptable query performance when searching for a subset of logs within a particular time range.
Sorted columnar data also adds another side benefit: efficient compression. Since sorted data in a column file tends to be similar and contains repeated adjacent values, it compresses well, as compared to compressing a series of rows.
Companies, such as Uber and CloudFlare, transitioned from Elasticsearch to ClickHouse due to Elasticsearch’s limitations in handling high data volumes. The combination of sparse indexes and efficient compression allowed CloudFlare to remove sampling completely.[1]
9.2 Moving Data in (near) Real-Time
Now that we had chosen ClickHouse as our database, the next challenge we faced was how to move log data from the CDN to ClickHouse in real-time. This represents the shipping stage, and therefore, we needed stream storage, a log transformer and a log shipper. For the prototype, we prioritized development speed and reliability, relying on well-established and mature industry tools for these components.
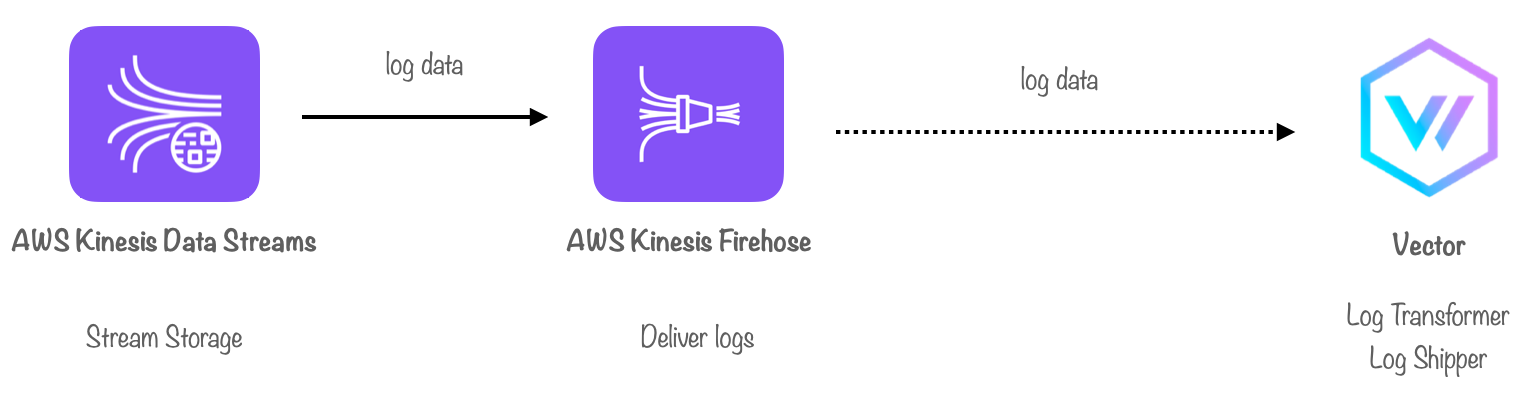
By default, CloudFront real-time logs are delivered to AWS Kinesis Data Streams, a fully managed service for collecting and storing data in a stream. As a result, this is the first stop in our pipeline. Each stream consists of one or more shards - a unit of capacity - where log records are grouped and stored, with their order preserved.
After logs are stored in a stream, we needed a way to deliver them to our log transformer. One option was to build an application that would read data from Kinesis Data Streams, process the data and deliver it.
Ultimately, we chose AWS Kinesis Data Firehose, a fully managed service for data delivery. As Firehose has a minimum buffer interval of 60 seconds, we use it to provide a “near real-time” solution for delivering logs.
Finally, we needed a log transformer and a log shipper. One option was to build both components in tandem, which would streamline our overall architecture.
Ultimately we opted to use Vector, an open-source tool for aggregating, transforming and routing observability data. Since Vector was out-of-the-box compatible with both Firehose and ClickHouse, it was a convenient choice to use as a data pipe between the two components, in addition to performing log transformation.
9.3 Data Transformation
The next challenge we faced was how to transform logs before loading the data into ClickHouse. Each CloudFront log is emitted in the form of a plain-text string with no predefined fields included.
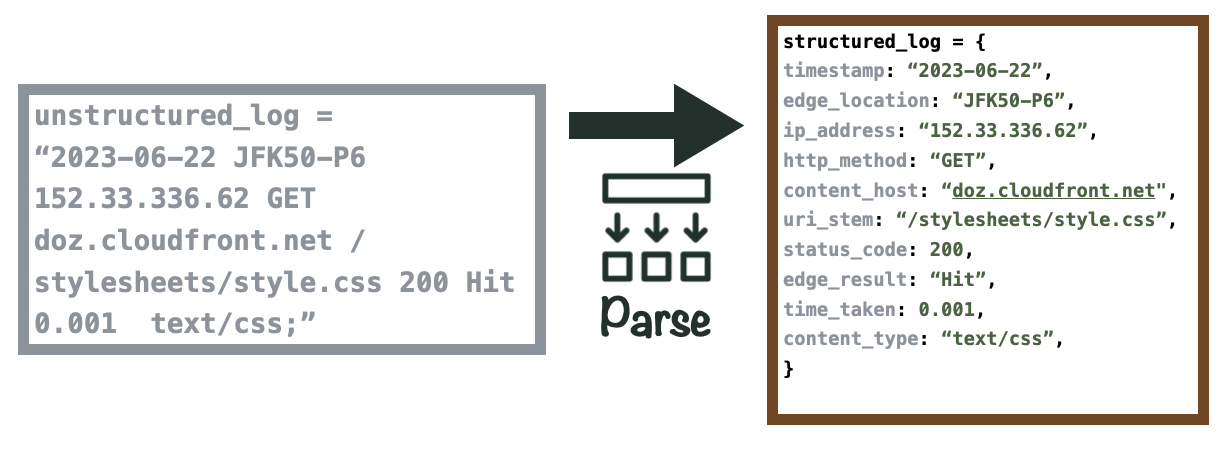
With Vector, our log transformer, we use its built-in parsing function to write a custom regex pattern. This pattern converts the log into a structured JSON object and maps field names to their corresponding values within the log. Finally, we convert specific values to the appropriate data types for storage in ClickHouse. For example, timestamps are stored in the “DateTime” format, while CDN edge locations are stored as strings.
The appeal of using Vector in this context stems from its dual functionality as a data pipe linking Firehose to ClickHouse. Using Vector allowed us to rapidly build our prototype architecture.
9.4 Deploying the Canopy Backend
After successfully addressing data storage, moving data in real-time and data transformation, we had developed a functional prototype on our local computers. However, one final challenge remained: ensuring that anyone could set up and start using Canopy as easily as possible. This goal necessitated deploying Canopy to the cloud.
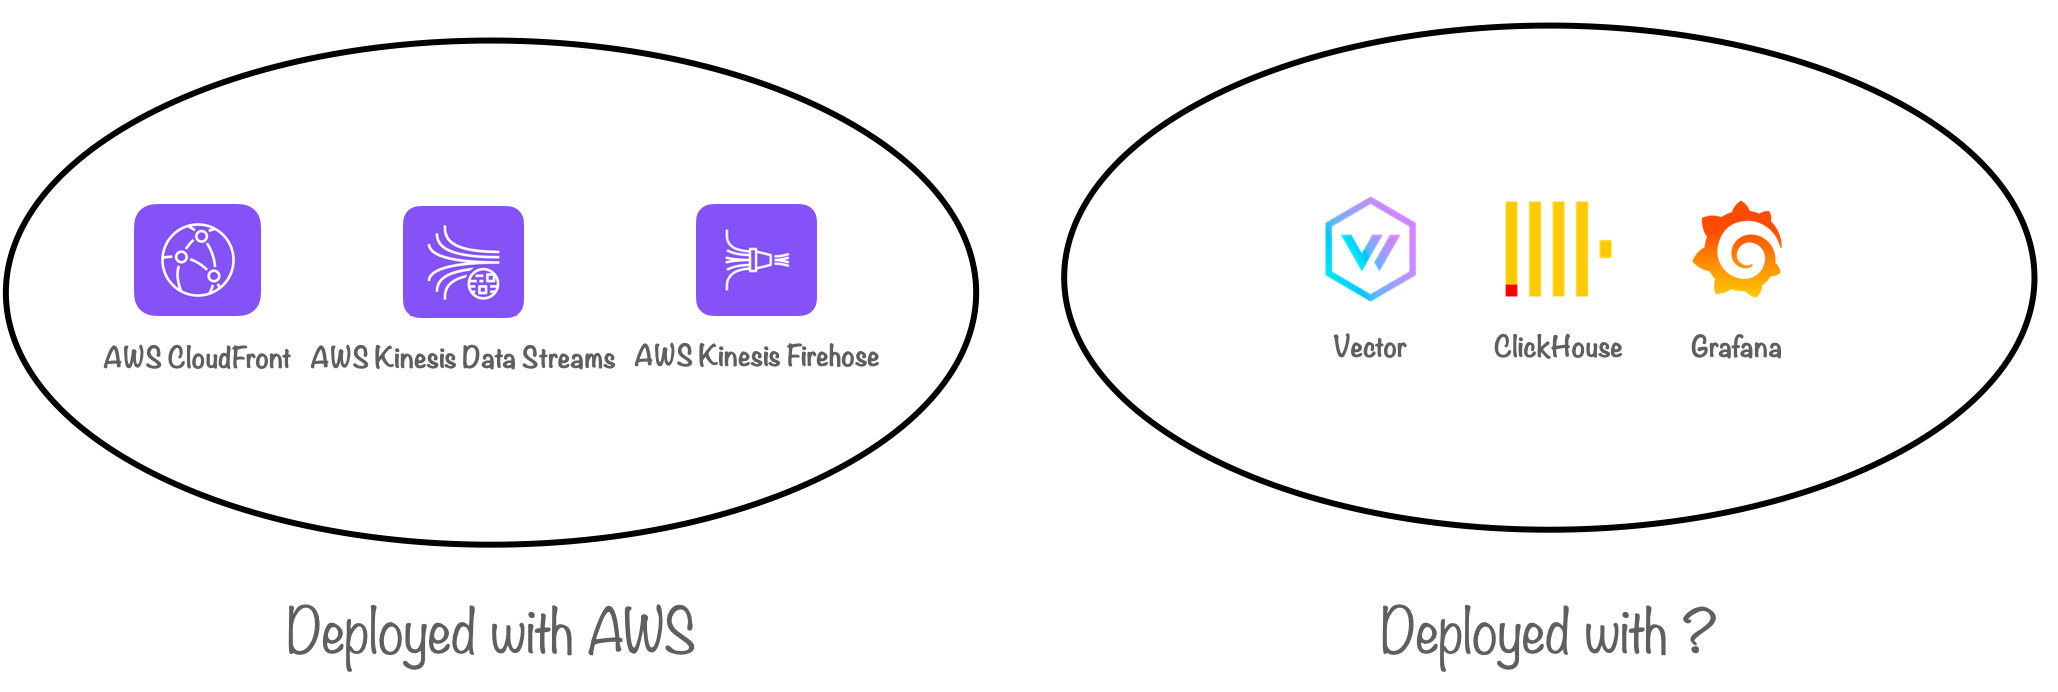
While Data Streams and Firehose are directly created within AWS, for the other components comprising the Canopy backend (Vector, ClickHouse and our visualizer, Grafana), our first priority was deploying them locally.
Ultimately, the solution we chose was Docker. We leveraged Docker to containerize our backend components and used Docker Compose to deploy and run them as containers on a host. With built-in service discovery, our containers automatically communicated with each over a private network. Moreover, built-in data persistence ensured preservation of both the data in our database and the dashboards in Grafana.
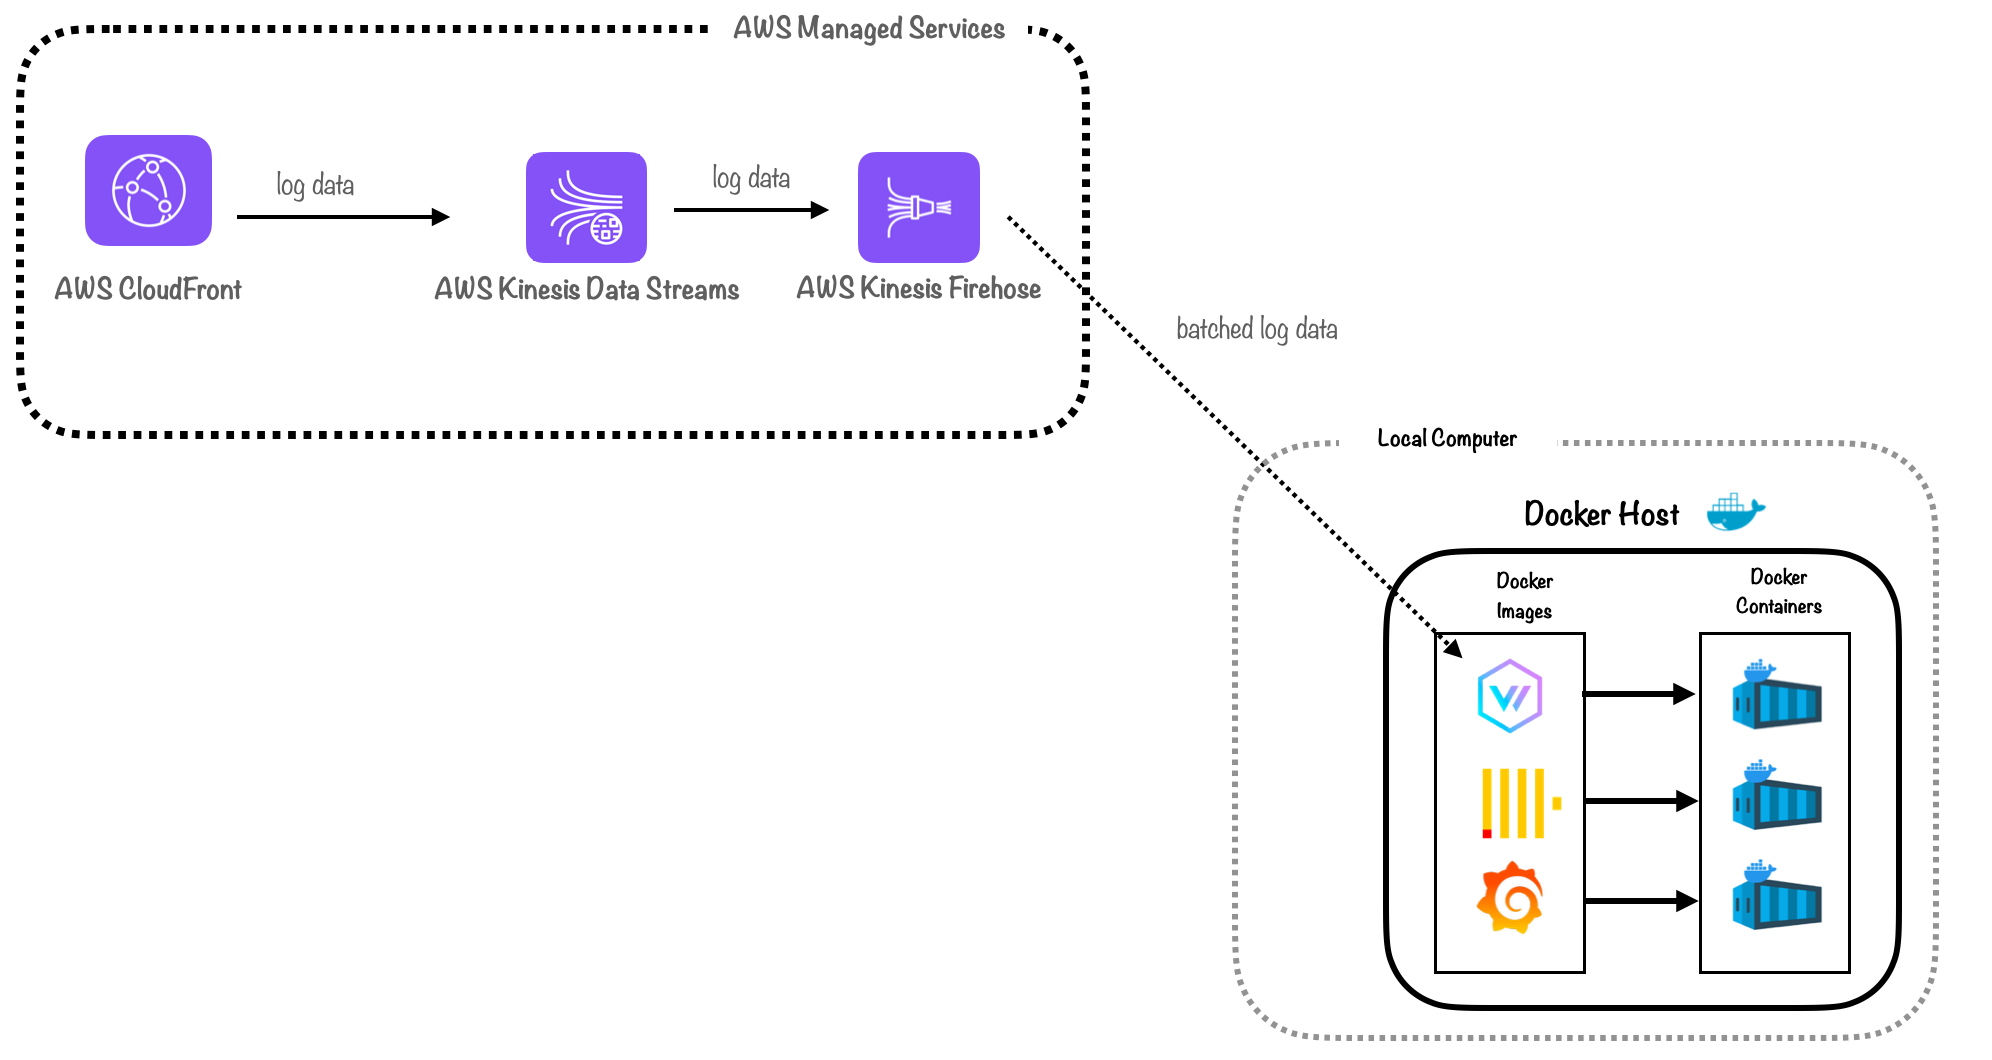
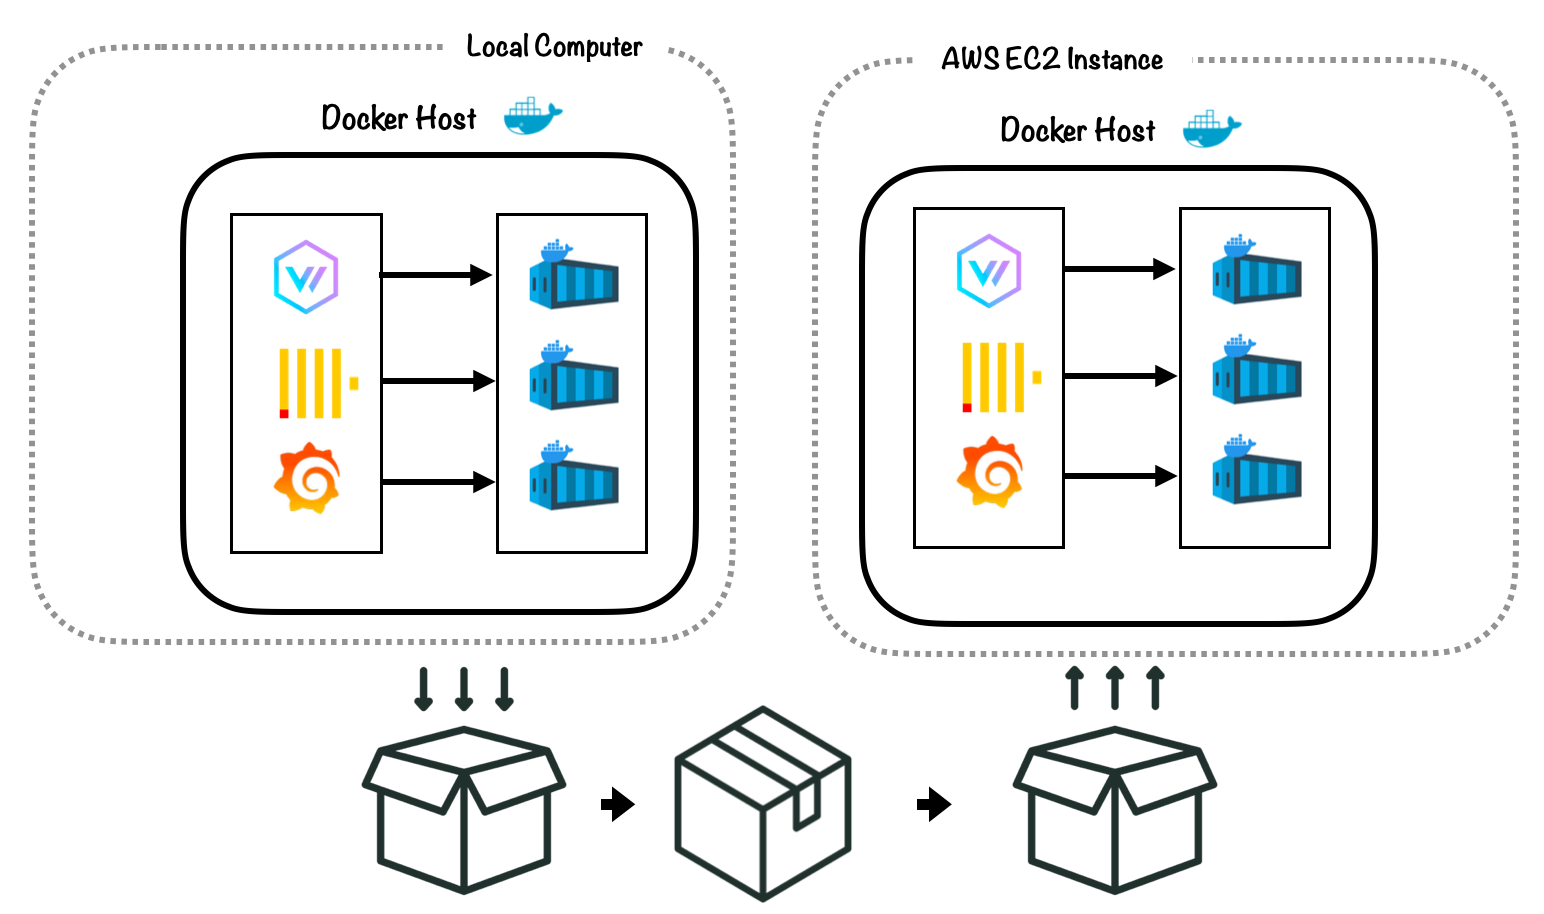
Docker also integrates well with AWS. Once we had the Docker setup working locally, it simplified the process of moving our backend to the cloud.
We considered two options for cloud deployment: Amazon EC2 and Amazon Elastic Container Service (ECS) with Fargate.
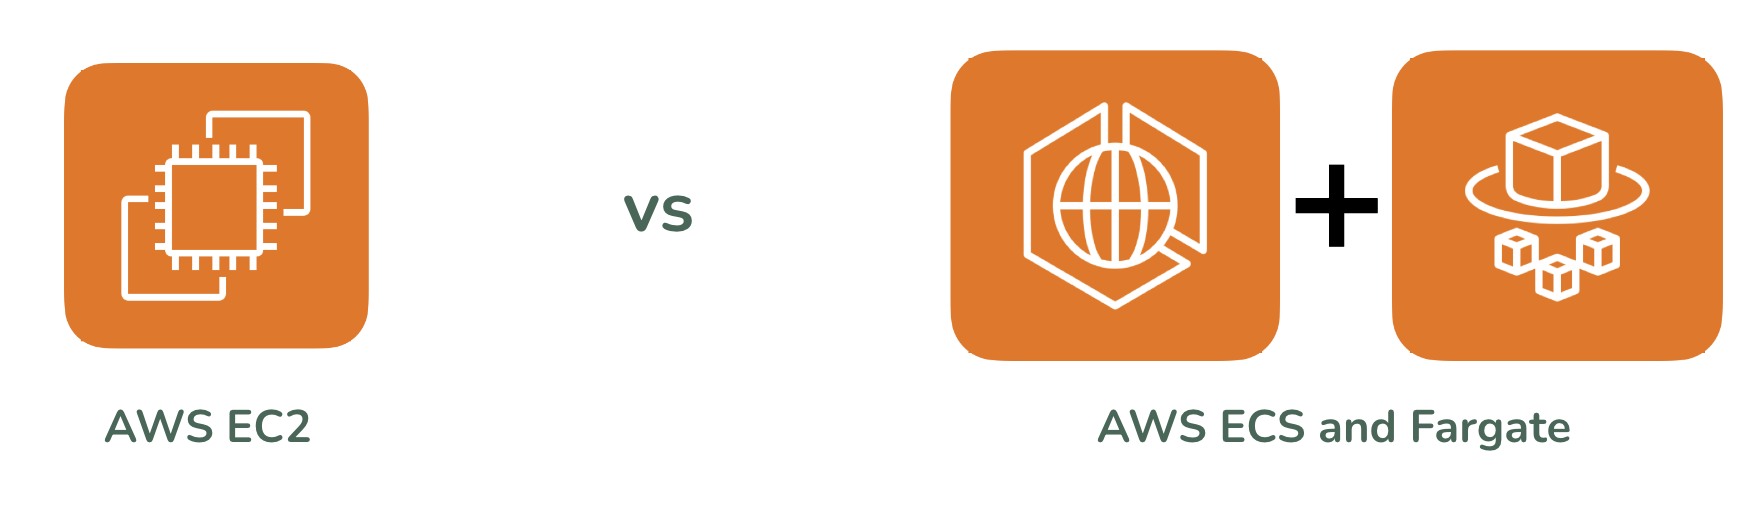
EC2 is a virtual private server service. In this scenario, we rent a virtual private server - or an instance of EC2 - and run our backend as Docker containers within that instance. ECS and Fargate are fully managed services, eliminating the need for manual management and scaling of containers and the infrastructure they’re hosted on.
Ultimately, for simplicity purposes, we opted for the EC2 instance. Deploying Docker containers on EC2 mimicked the process of deploying on a local computer. Configuring our containers to work with ECS and Fargate for data persistence and service discovery involved substantial complexity. We decided to forgo that complexity for creating a working prototype.
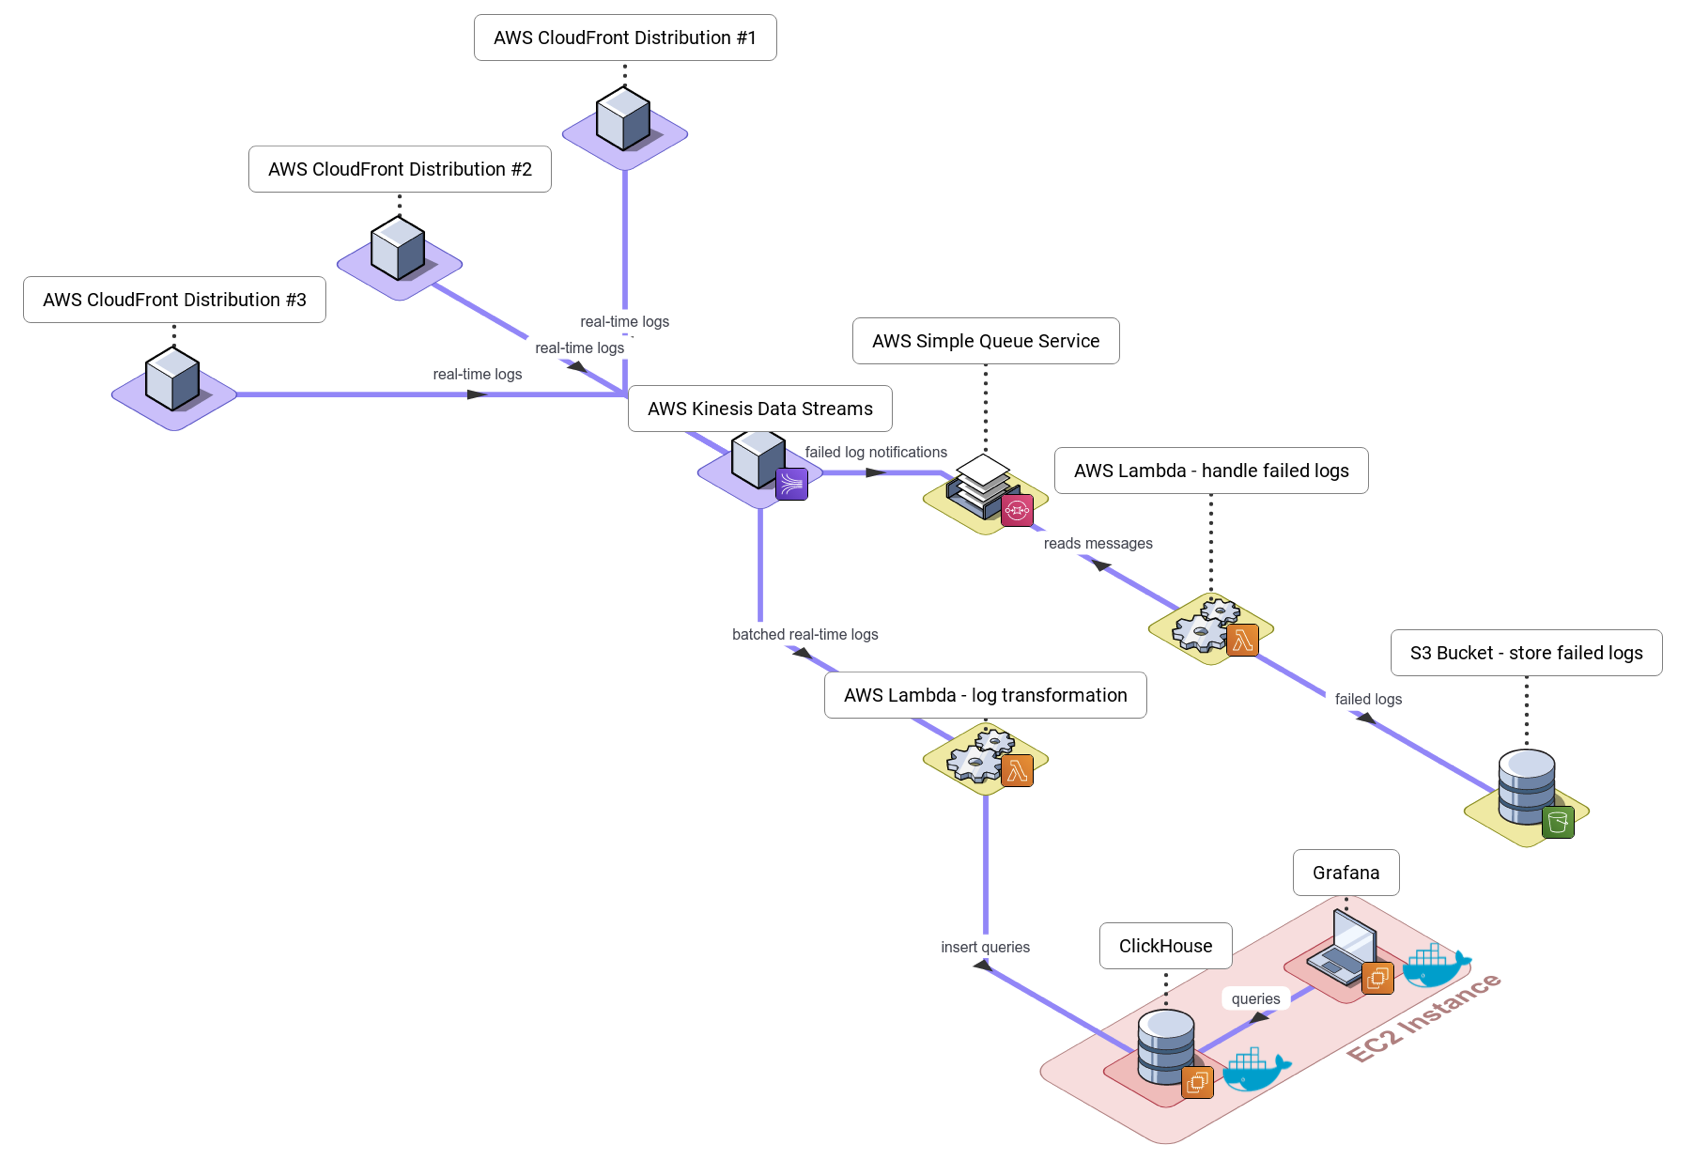
9.5 Prototype Architecture
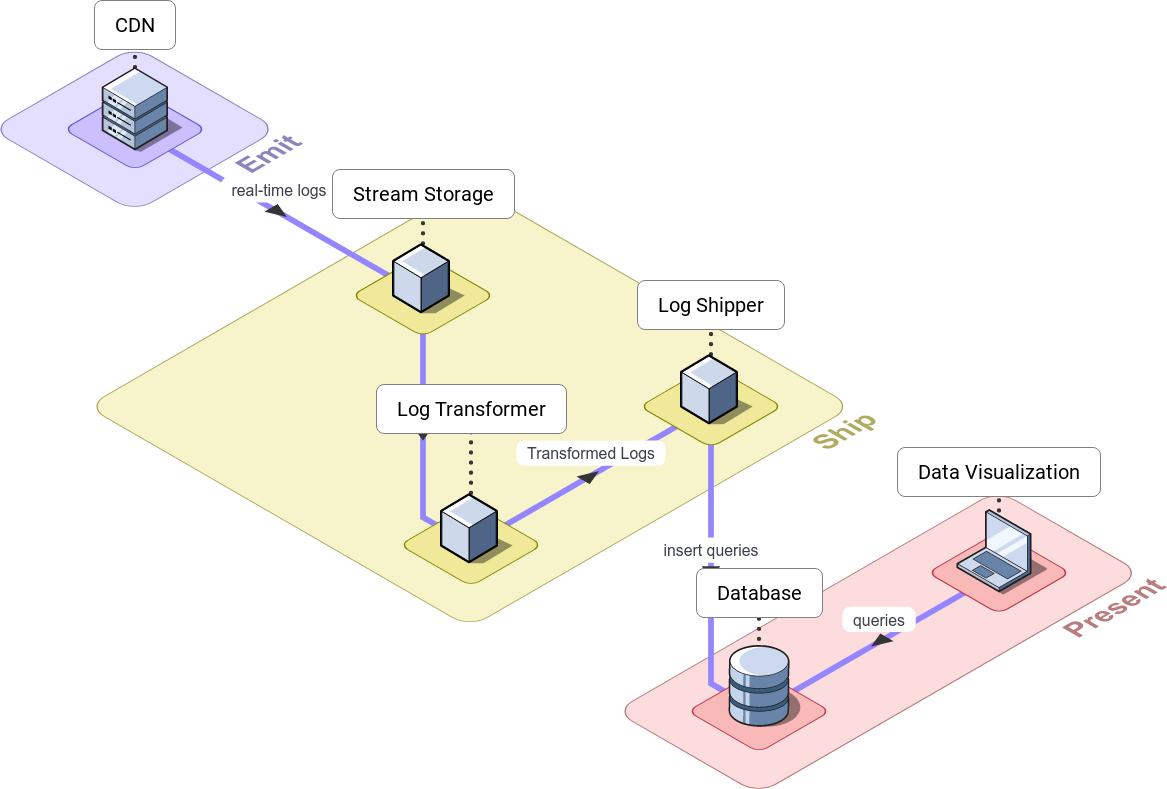
The diagram below shows our prototype architecture, which we built to address the fundamental challenges discussed previously.
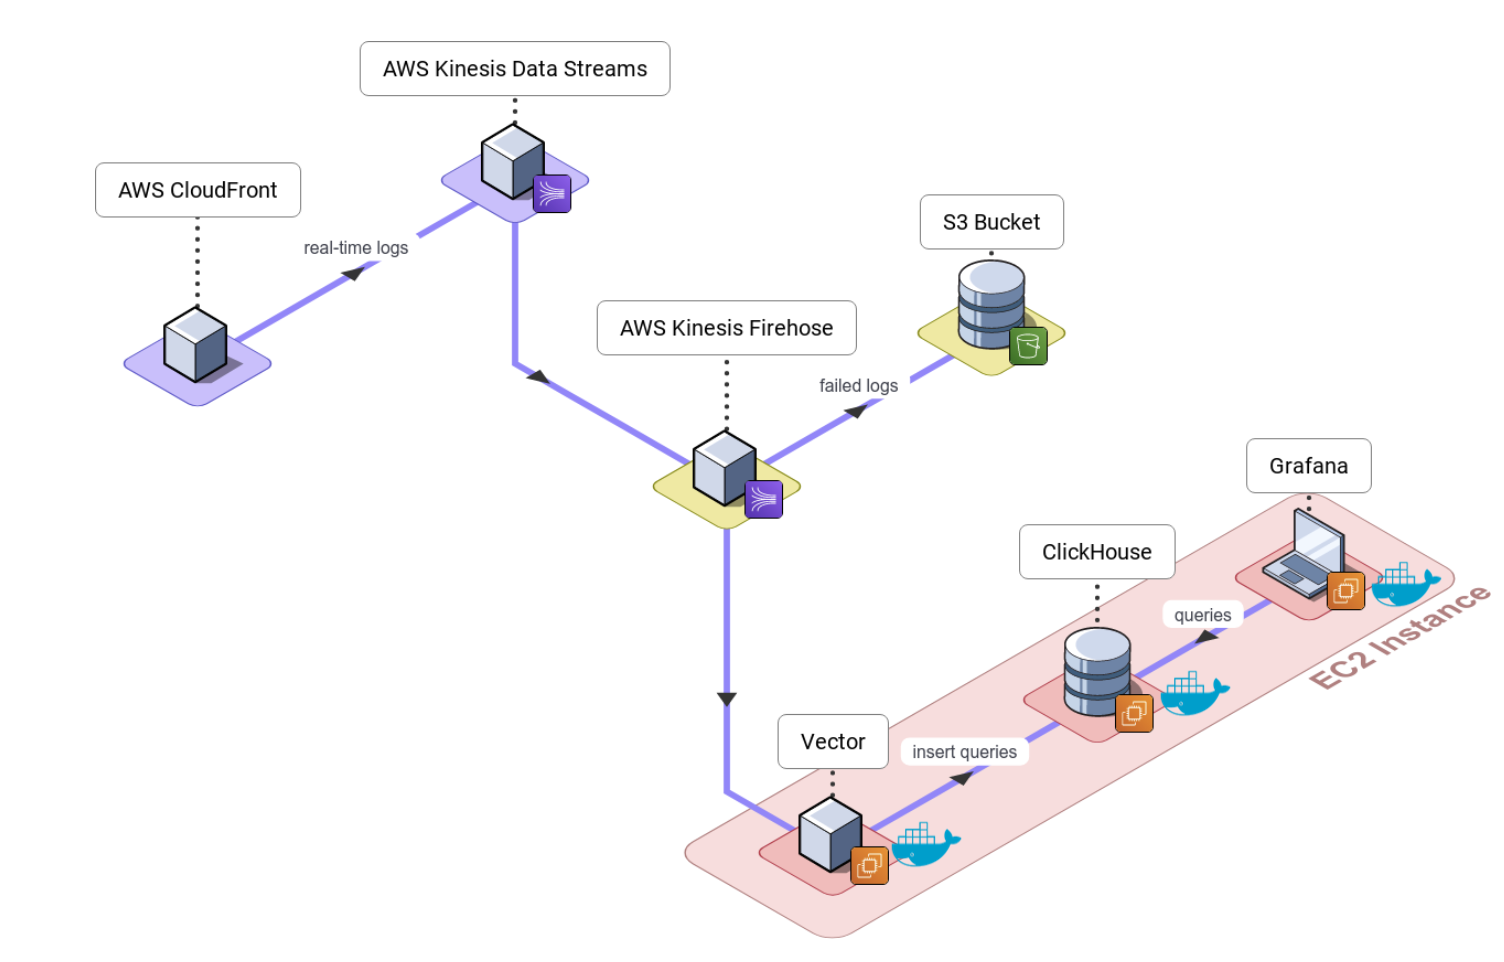
With this prototype, we successfully implemented a working solution. Users could deploy our backend infrastructure to an EC2 instance, and visualize logs and metrics in near real-time on Grafana dashboards. However, to improve ease of use, we still needed to automate the deployment of our cloud infrastructure.
10. Automating Cloud Deployment
Setting up and properly configuring AWS resources can be complex, and automating this process would relieve developers from that burden. To accomplish this, we used AWS CDK to automate cloud deployment, and we built a command line interface to make configuration and deployment more intuitive.
10.1 Amazon CDK
AWS CDK (Cloud Development Kit) is an infrastructure-as-code tool that deploys all our AWS resources with code written in JavaScript. We use it to automatically deploy Kinesis Data Streams, Kinesis Firehose and Canopy’s backend - Vector, ClickHouse and Grafana - on Amazon EC2.
AWS CDK serves as a wrapper for Amazon CloudFormation. CloudFormation uses a declarative language - YAML or JSON - as a template to provision cloud resources. With CDK, we combine the capabilities of CloudFormation with the convenience of JavaScript. We selected CDK over other tools like Terraform, primarily for simplicity. We did not want to introduce another third-party tool into our architecture when a native AWS solution was readily available.
10.2 Building the Canopy CLI
With Docker containers and CDK code in place, our users could now deploy all of Canopy’s architectural components with greater ease. To make this process more intuitive, we decided to build a command-line interface (CLI).
Deploying cloud architecture requires correctly configuring AWS account details. Building a CLI enabled us to prompt users for the required information, such as their AWS account ID and CloudFront distribution ID, instead of requiring them to navigate through a detailed set of configuration steps. Additionally, by offering intuitive CLI commands, such as “canopy deploy” and “canopy destroy”, we removed the need for our users to worry about the underlying file structure of our deployment code.
Upon building and automating Canopy’s prototype architecture, we achieved a working solution accompanied with a user-friendly deployment and configuration process. However, during the course of prototyping, we identified areas where we could improve upon how Canopy could better suit its use case. With its core functionality in place, we set out to optimize and refine our current working version of Canopy.
11. Technical Challenges: Improving the Core Pipeline
When we set out to make Canopy, two of our key goals were:
-
Ease of Use: We wanted to create a solution that would be as easy to set up and use as possible.
-
Real-Time Dashboard Updates: We wanted to deliver a true "real-time" experience. This meant dashboards that updated instantaneously as log data streamed in, enabling users to monitor events in real-time.
11.1 Limitations to Ease of Use
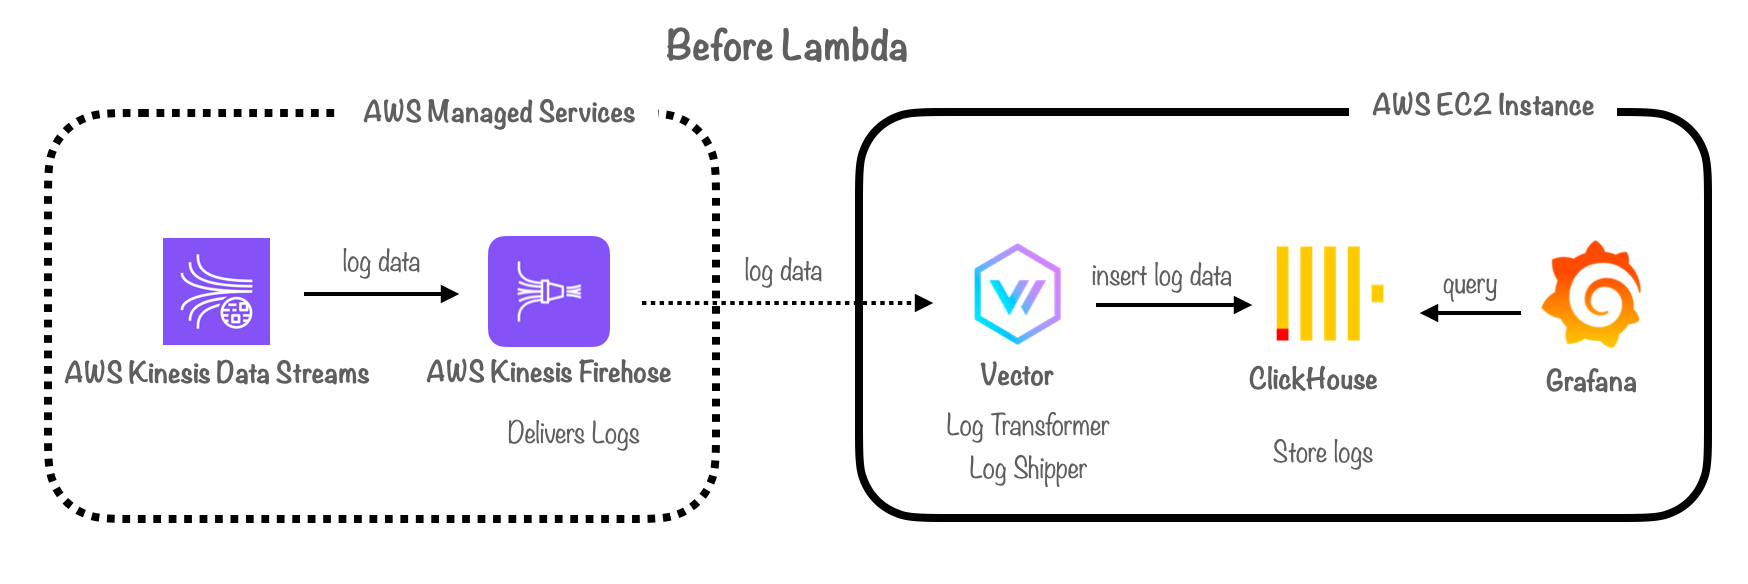
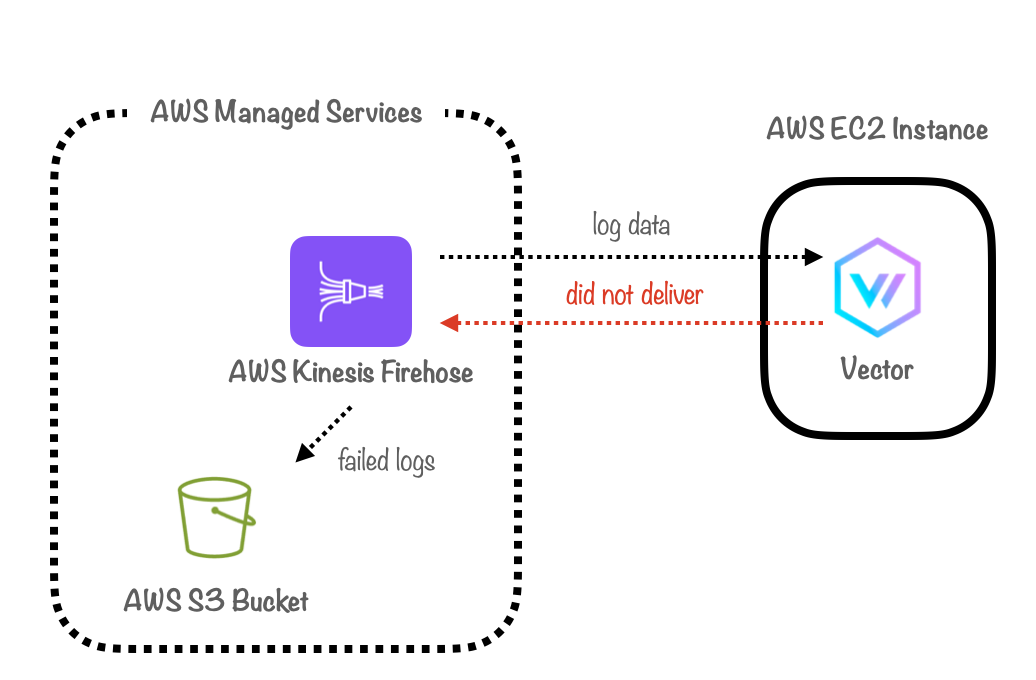
Our initial prototype relied on Kinesis Data Firehose to deliver data from Kinesis Data Streams to the log transformer, Vector, over an encrypted HTTPS connection. This approach exposed several limitations.
First, Firehose’s HTTPS requirement limited ease of use by making configuration more complex. Specifically, it forced our users to create a new domain or subdomain, generate their own TLS certificate file, upload the certificate, maintain certificate validity, and update DNS records with the IP address of our dynamically generated EC2 instance. These tasks placed a substantial burden on the user and made our solution more difficult to set up and use.
11.2 Limitations to Real-Time Dashboards
Using AWS Firehose revealed another limitation. Firehose buffers data for at least 60 seconds before streaming it to its destination, resulting in unwanted latency. Additional latency is also introduced by:
-
The HTTPS connection between Firehose and Vector: A 3-way handshake plus a TLS handshake means 3 additional round trips across the wire before log data is routed to ClickHouse.
-
Routing parsed log data from Vector to Clickhouse: another 3-way handshake.
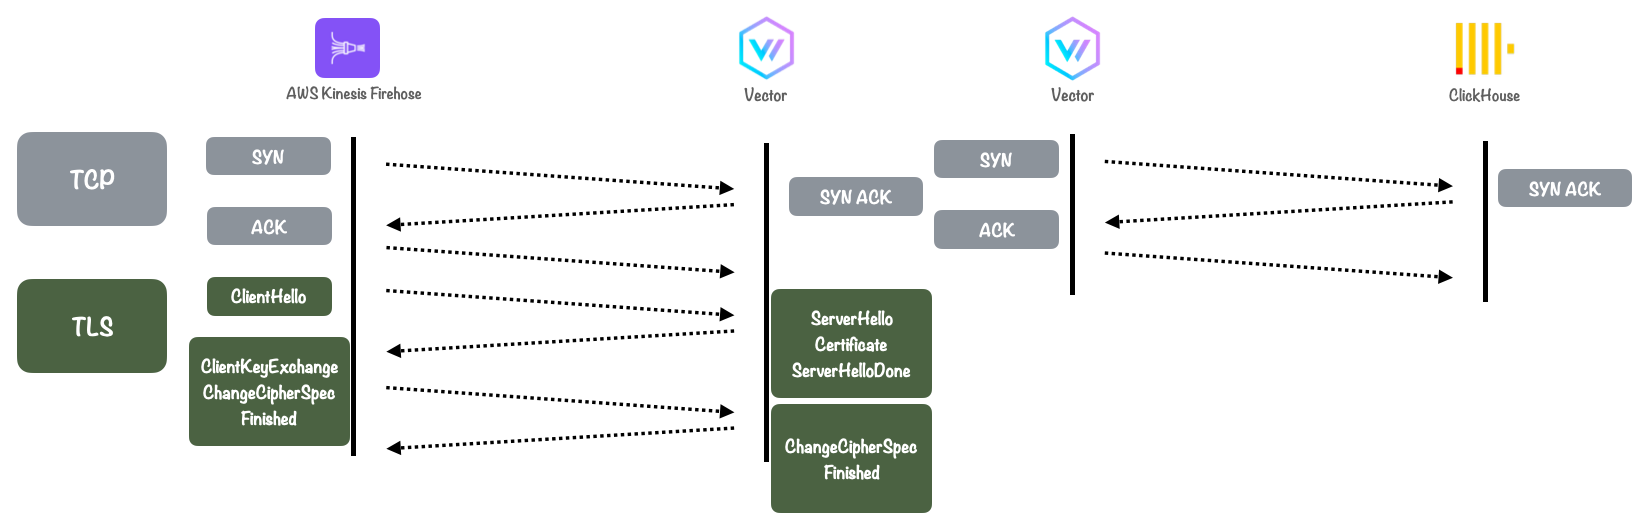
This introduced a delay of over a minute before logs could be stored in ClickHouse and visualized in Grafana, thus preventing Canopy from delivering a true real-time experience.
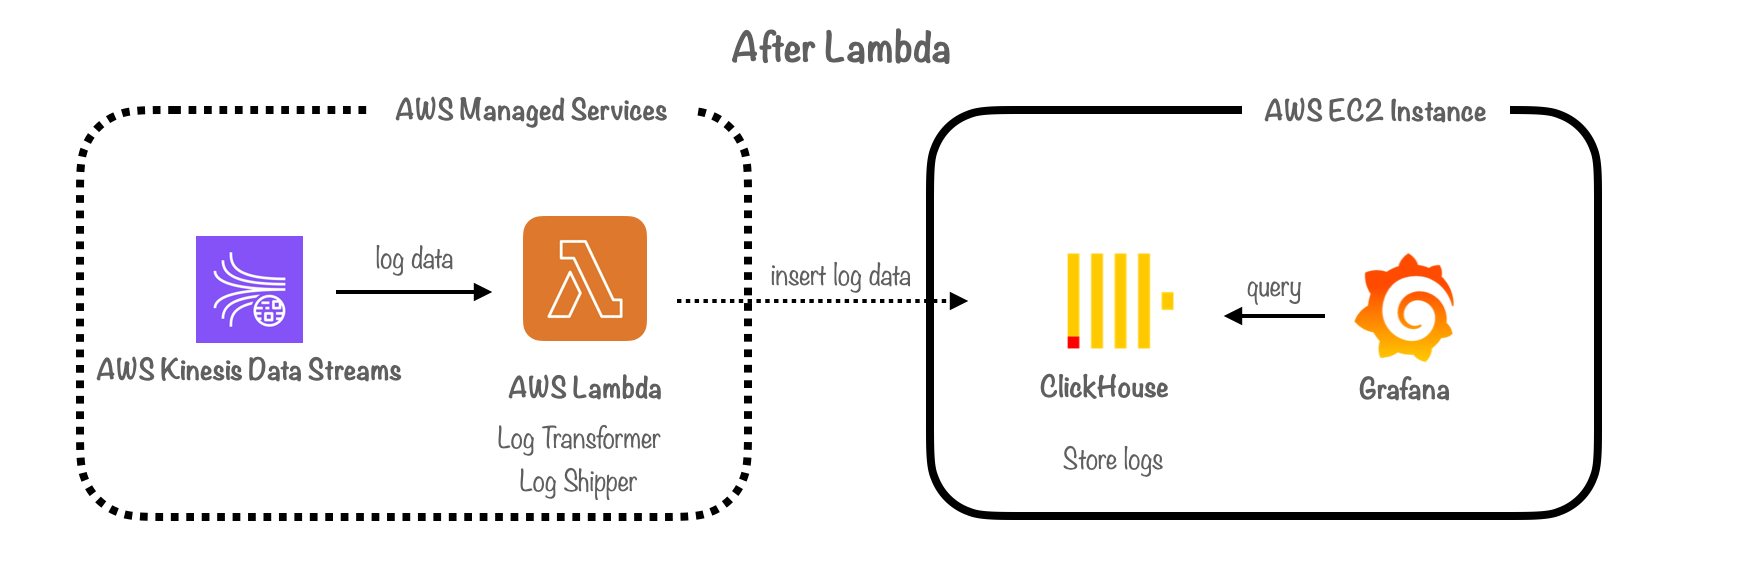
11.3: Solution: Building a Custom Log Transformer/Shipper Using AWS Lambda
To overcome these limitations, we made the strategic choice of building a custom log transformer and shipper using AWS Lambda. This decision enabled us to simplify the architecture, eliminating the need for both Vector and Firehose. The Lambda function fulfills two critical roles:
-
Log Transformer: By incorporating the decoding, parsing, and transformation logic within the Lambda function, we reduced the number of hops logs needed to traverse to reach ClickHouse, resulting in reduced latency.
-
Log Shipper: The Lambda function routes logs directly to ClickHouse immediately after they are read from Kinesis Data Streams and transformed by the Lambda. This results in a true “real-time” solution, in contrast to the previous “near real-time” setup associated with Firehose.
11.4 Using AWS Lambda with SQS & S3 For Failover
In addition to simplifying Canopy’s architecture, our Lambda-based solution offered the following benefits:
-
Flexible Buffering: Using Lambda gave us complete control over log buffering. We could adjust the buffer to replicate Firehose's 60-second buffer or achieve an even more real-time buffer (with intervals as low as 0 seconds), depending on the needs of our users. While opting for a shorter buffer interval could lead to more frequent database writes, ClickHouse can handle batch insertions as frequently as once per second.
-
Versatile Data Transport: Using a Lambda function allowed us to ship logs over HTTP, removing the need for users to perform the manual configuration steps required for setting up an HTTPS endpoint with Firehose. Since log data is transported within our architecture, we felt the benefits of using HTTPS were outweighed by the inconveniences in terms of user-friendly deployment and maintainability. In the future, we aim to reintroduce support for users who prefer or need to configure deployment using HTTPS. Lambda can support both use cases.
-
Improved Latency: Logs can now be parsed and routed directly to ClickHouse from the Lambda function, reducing network hops from 2 to 1 (by removing Vector) and network round trips from 3 to 1 (by removing the need for TLS handshakes), resulting in reduced latency.
-
Improved Debugging: When our Lambda code throws an error, Lambda records a log that details exactly what happened, which is convenient for debugging network and infrastructure faults. Firehose lacks this feature, making debugging a potentially frustrating process.
-
Scalability: The Lambda function's ability to process up to 10,000 records per invocation aligned well with Canopy's requirement to handle a massive number of logs, surpassing Firehose's maximum batch size of 500 records.
11.5 Handling Failed Logs
One of the major challenges in dealing with a distributed system is accounting for network failures.
What happens if logs cannot be successfully delivered to the database due to ephemeral network failures or if they fail to be inserted into the database due to database server errors?
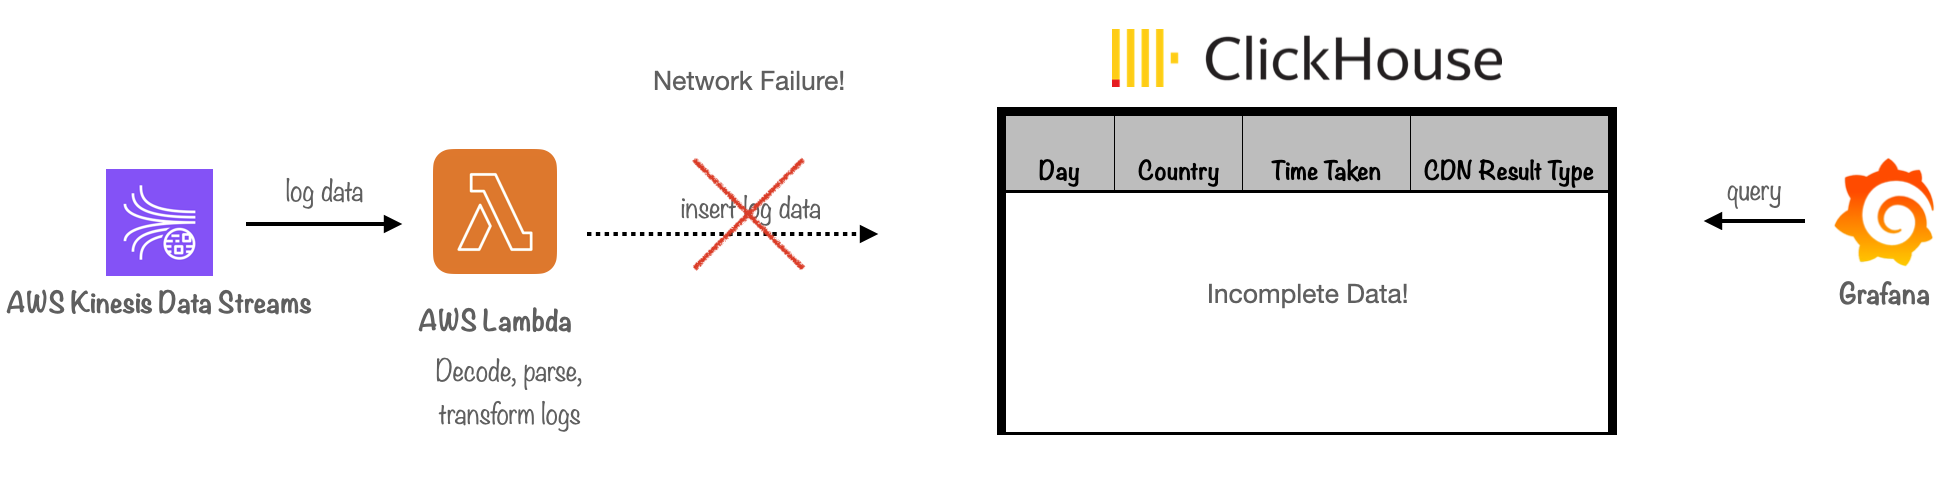
In our prototype, Firehose handled failed logs for us. It routed batches of logs that couldn't be successfully delivered to the database towards S3 for storage.
We could have implemented a similar solution with our Lambda function, routing failed logs to S3 based on error response codes from requests sent to ClickHouse, or by utilizing the failed request callback handler. However, this approach posed a problem: logs that failed and were stored in S3 cannot be visualized on our Grafana dashboards. As a result, the data and metrics presented to our users could become inaccurate.
To address this issue, we leveraged Kinesis Data Streams as a buffer for failed logs. We configured our Lambda function to throw an error if a batch of logs could not be inserted into Clickhouse or if the request failed. This action triggered Kinesis Data Streams to re-stream failed logs, according to a configurable setting that tracks the age of the logs in the stream.
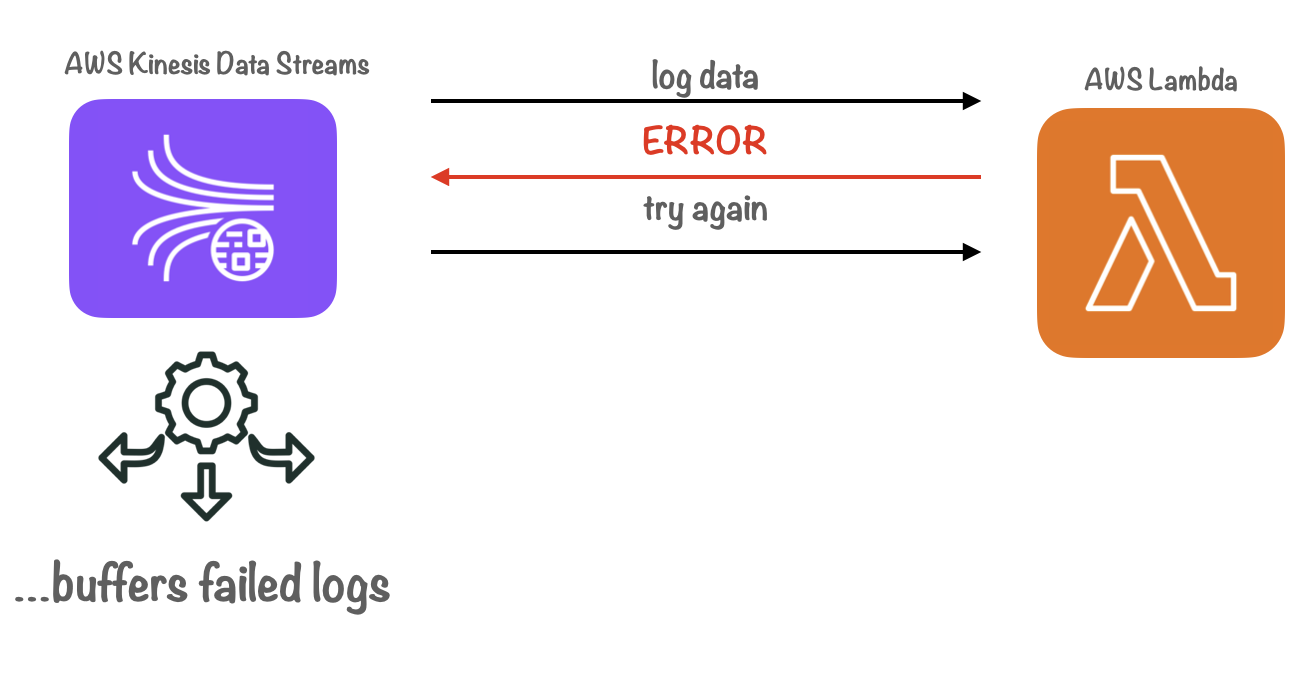
We also configured the Lambda function to retry shipping failed logs based on the recorded number of retries. Only after reaching a max-retry limit would the data be sent to S3. This approach ensured that ephemeral network outages or database server errors would not result in inconsistent data in our Grafana dashboards.
It’s important to note that this solution has a tradeoff: the additional monetary cost incurred for each Lambda invocation. However, we deemed these additional invocations necessary to prioritize data integrity and maintain the accuracy of the visualizations on the Grafana dashboards.
11.6 Archiving Failed Logs for Debugging & Compliance
Although this solution was effective, it raised another question: What happens when records in Kinesis Data Streams reach their max age or when the max-retry limit is met? In either scenario, failed logs would be ejected from the stream, and we would lose any record of them.
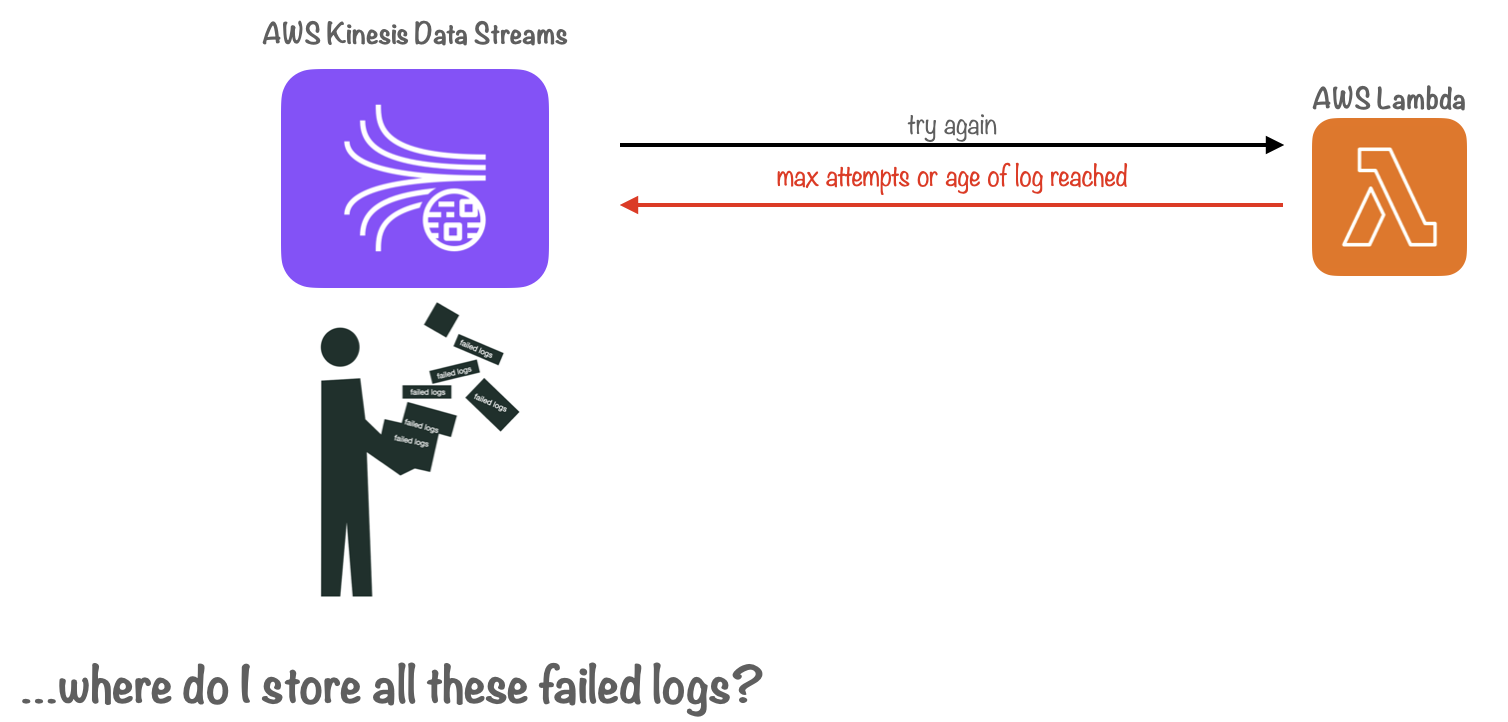
To address this issue, we created a separate pipeline for handling failed log data. This pipeline consists of a dead-letter queue, managed by AWS Simple Queue Service, along with a Lambda function that pushes failed logs to S3 for persistent storage.
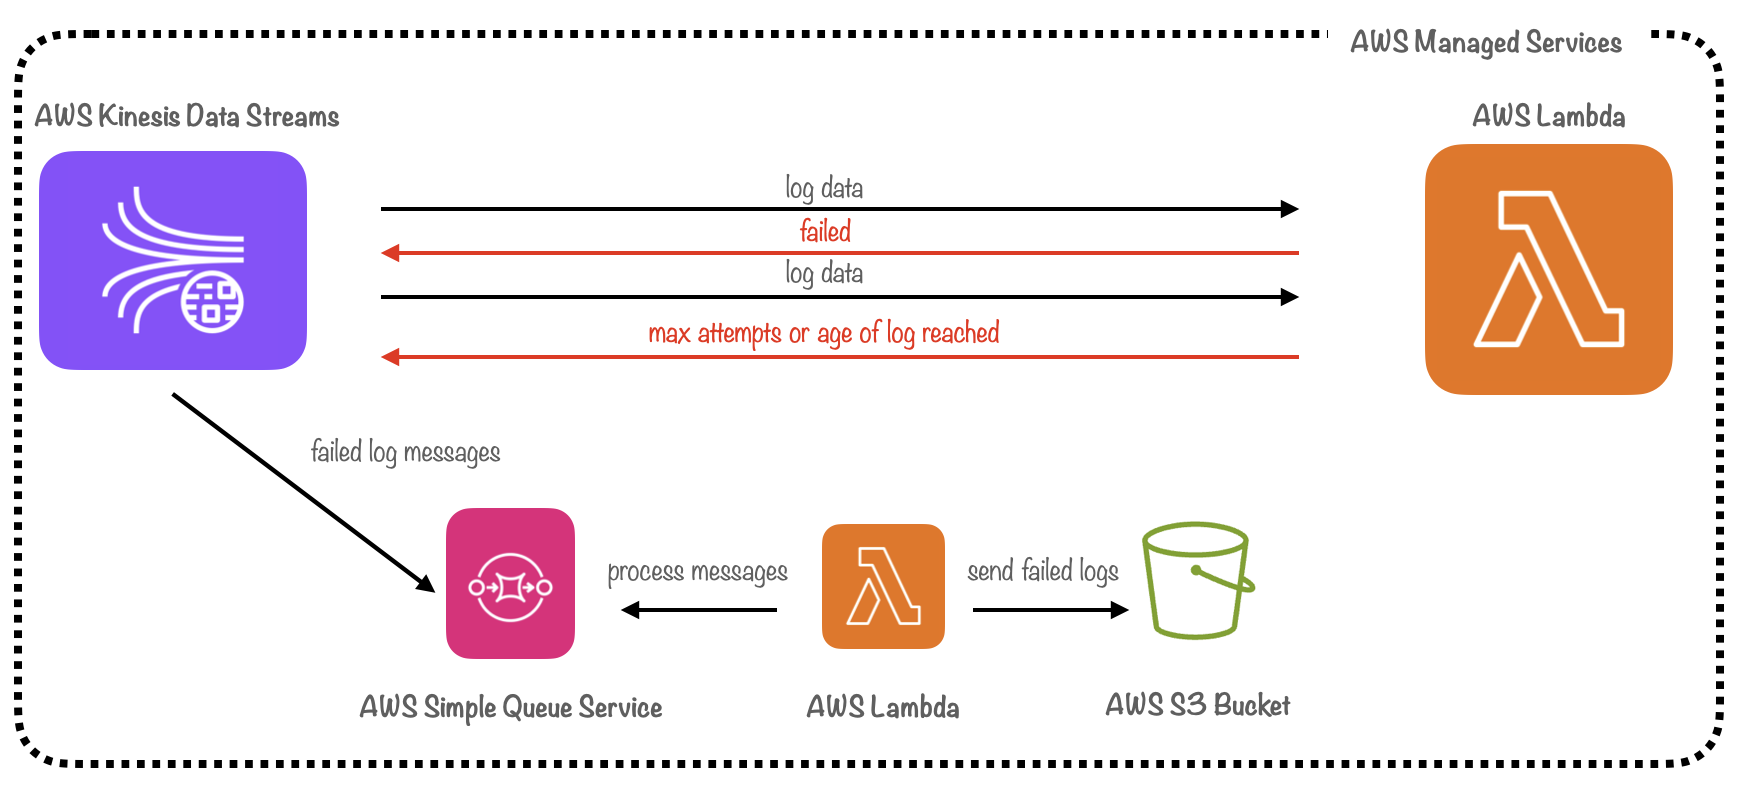
A dead letter queue is a type of message queue designed to temporarily store messages that a system fails to process due to errors.[13] Kinesis Data Streams pushes failed logs to the queue when the batch has failed after multiple retries. The Lambda function then reads from the dead-letter queue and stores the failed logs in S3 before clearing them from the queue asynchronously. While this approach introduced added complexity, it ensured that failed logs would be archived for debugging and compliance needs, supporting our core use case.
12. Beyond the Core Pipeline
The improved architecture provided our users a true real-time monitoring experience and simplified deployment, while also accounting for potential network failures. With the core pipeline elements in place, we turned our attention to "quality of life" improvements. This included adding support for monitoring multiple CloudFront distributions in parallel, as well as creating an Admin Dashboard for pipeline management.
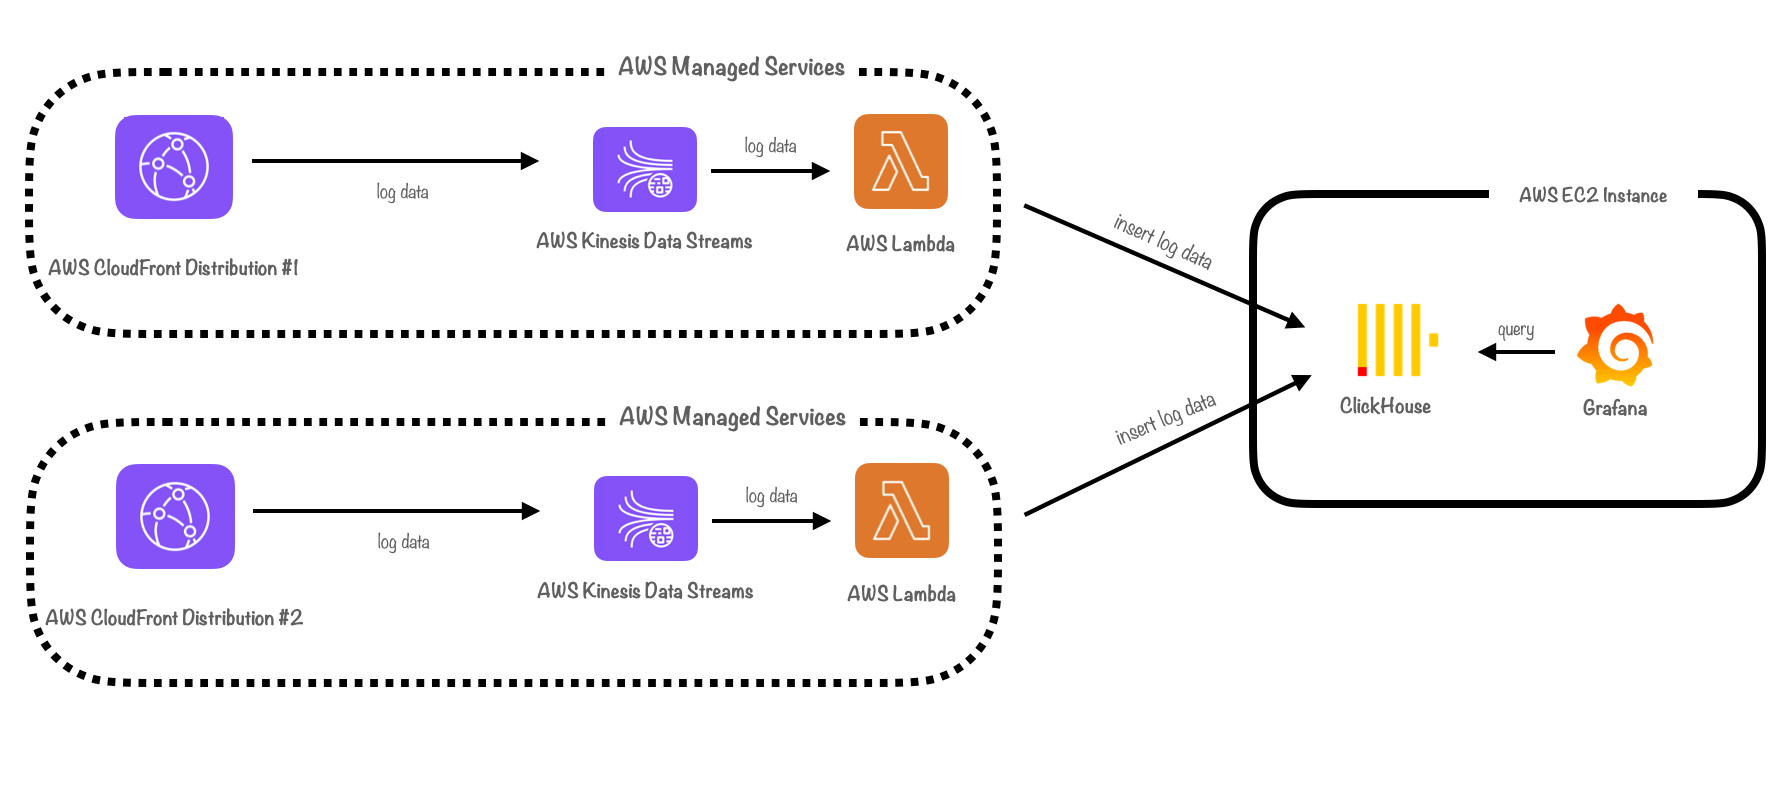
12.1 Adding Support for Parallel CloudFront Distributions
At this juncture, Canopy only supported working with a single CloudFront distribution. However, it is not uncommon for development teams to have multiple distributions within a single AWS account. Distributions can be configured with different cache-control policies, geographic restrictions, and real-time log configurations, which can be useful when working with multiple domains that require different CDN settings.
To accommodate monitoring multiple distributions, teams would need to either duplicate Canopy’s pipeline infrastructure, or manually attach another distribution to the existing pipeline. To better serve these users, we decided to add native support for multiple parallel CloudFront distributions.
12.2 Weighing Options for Parallelization
When considering how to implement support for multiple CloudFront distributions, we evaluated two main options: parallelization and consolidation.
Parallelization meant “parallelizing” or duplicating the shipping part of our pipeline. Parallelizing components could help our pipeline scale by adding extra capacity. For example, assigning a separate Lambda function to each distribution would ensure that the processing power scales linearly with each additional distribution.
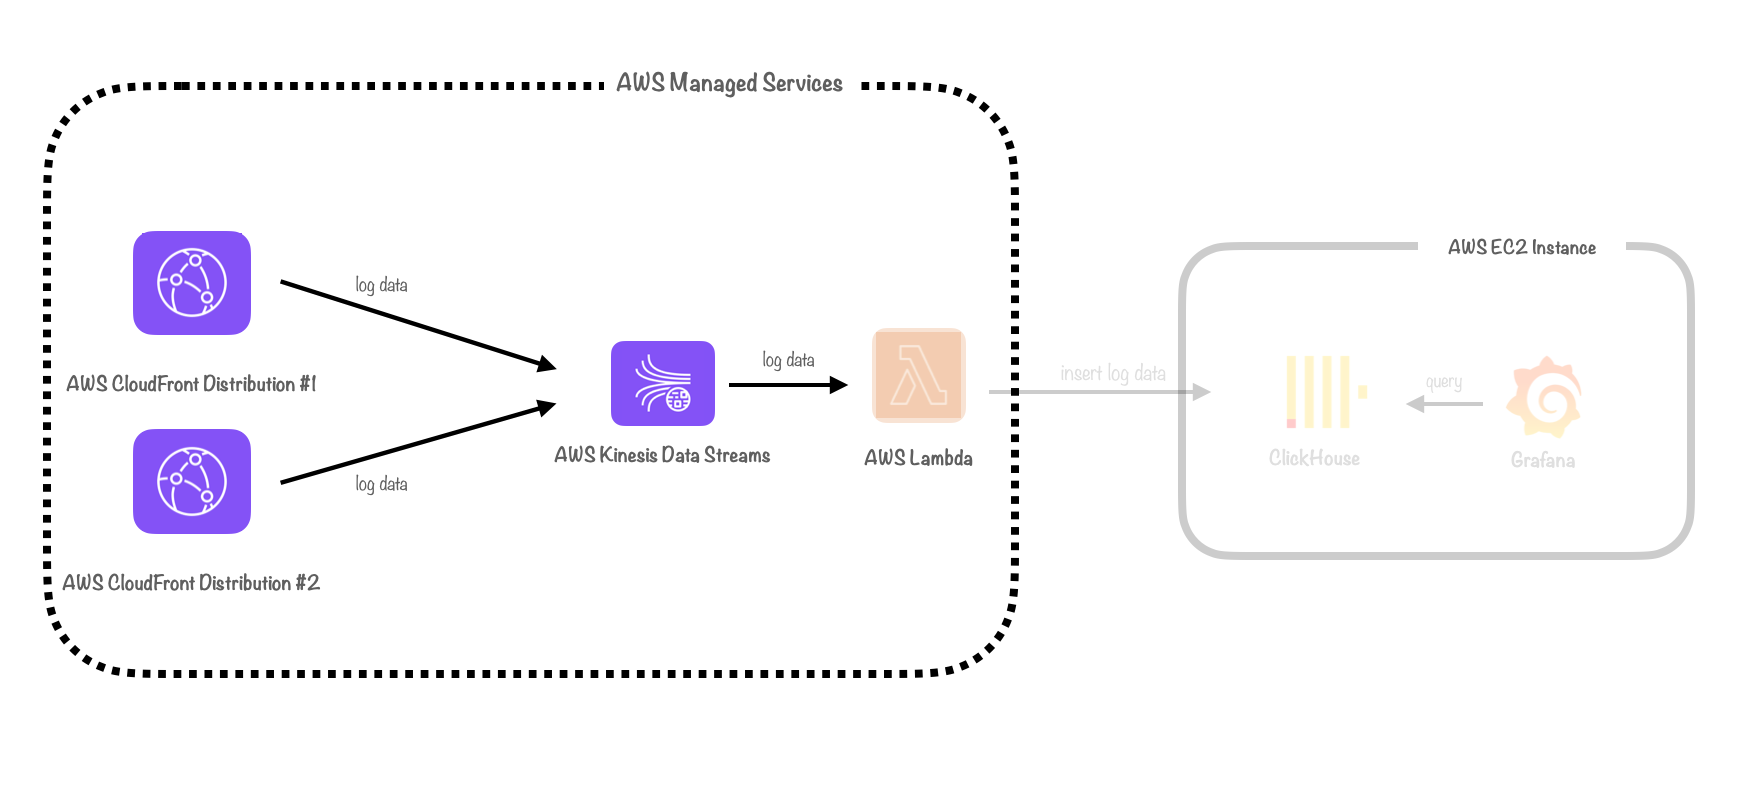
On the other hand, consolidation meant parallelizing as few components as possible and instead consolidating log data from different CloudFront distributions into the same pipeline.
Ultimately, we opted for consolidation. Duplicating infrastructure can lead to increased costs and complexity. We would need to keep track of all parallel components so that they could be monitored and torn down. Ingesting logs from multiple distributions into a single pipeline was simpler and more maintainable, eliminating the necessity for additional cloud components to manage.
12.3 Attaching a Distribution
To attach an individual CloudFront distribution to the logging pipeline, we created the `canopy add` CLI command. This command automates attaching a distribution to the pipeline with Canopy’s default sampling rate (100%) and data model (all CloudFront logs fields are included in a log record). After attaching a distribution, logs originating from the distribution are emitted into the Canopy pipeline and can be visualized in Grafana within minutes.
When the `canopy destroy` command is run, all distributions are detached from the pipeline before Canopy’s AWS resources are deleted.
12.4 Keeping Track of Distribution IDs using SQLite
In order to track data associated with multiple distributions for use in our Admin Dashboard, we opted to use SQLite. SQLite is a robust, open-source relational database that does not need a server to run and requires minimal configuration. We initially considered PostgreSQL, but encountered several issues.
Configuring Postgres required a complex setup using a Bash script, a process which varies depending on the operating system. Additionally, if a user shut down their system, they would need to restart the database server before opening the Admin Dashboard. SQLite provides all the functionality necessary for our use case, while reducing complexity and offering an improved user experience.
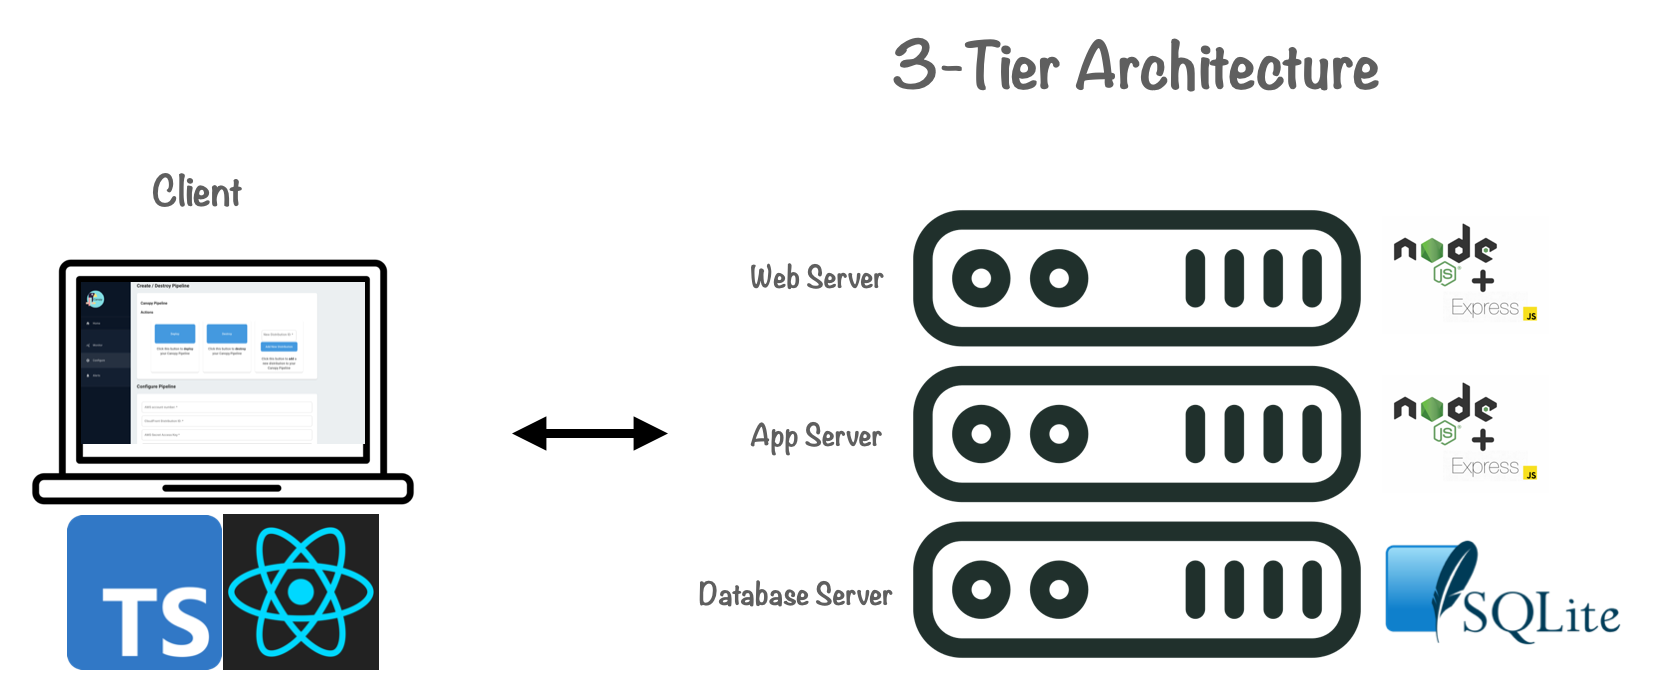
12.5 Building the Admin Dashboard
The other improvement we made was building a custom Admin Dashboard. We adopted a “3-tier” architecture, with a presentation tier, application tier and data tier, where a TypeScript-based React UI communicates with an Express web server and application server, and SQLite for storage.The dashboard is installed locally and can be run using the CLI “canopy launchDashboard” command.
In addition to the features described earlier, the Admin Dashboard was designed to help monitor the Canopy pipeline infrastructure.
It collects and prevents metrics from ClickHouse and Grafana instances, enabling users to monitor the health of their deployed pipeline infrastructure.
It also displays a list of configured CloudFront distributions, the data of which is stored in the SQLite database. This capability provides users with a seamless way to track and manage their various distributions.
13. Final Architecture
Canopy’s final architecture represents a summation of all of the insights, iterations and problems we encountered along the way. The pipeline is built to efficiently ingest, ship, store, and visualize CDN log data. It is easy to use, has fully automated deployment, and features useful dashboards that update in real-time. It is able to gracefully manage ephemeral outages, and provides native support for monitoring parallel CloudFront distributions.
14. Conclusion
Building a real-time monitoring framework for CDN log data proved to be more challenging than we had initially expected. At the outset, it required us to carefully consider the complexities of working with large datasets. When building Canopy’s pipeline architecture, we then had to weigh the relative strengths of each component and build custom solutions where existing components fell short for our use case.
In the end, we achieved our objective of building an easy to use, fully-automated, real-time logging pipeline for CDN log data. However, there is always room for improvement and we hope to continue our work and improve Canopy in the future.
15. Future work
Some of the features we would like to incorporate in future iterations of Canopy include:
-
Adding the ability for users to perform custom transformations and enrichments on log records
-
Allowing users to choose between HTTP and HTTPS endpoints
-
Improved support for multiple CloudFront distributions, such as adding custom real-time logging configurations and additional dashboard visualizations
-
Improving the Quick Alerts feature, making it more customizable and offering more options for notification settings
-
Adding support for local deployment
-
Adding configuration options for ClickHouse and the EC2 instance
References
- Monitoring Distributed Systems, Case Studies from Google’s SRE Teams p1 ↩︎
- Jamie Riedesel "Software Telemetry" ↩︎
- Cisco Visual Networking Index ↩︎
- GlobalDots: The Benefits of Better CDN Monitoring ↩︎
- Monitoring Distributed Systems by Google ↩︎
- Data Pipelines Pocket Reference: Moving and Processing Data for Analytics, p1 ↩︎
- Jamie Riedesel "Software Telemetry" ↩︎
- Realtime Fastly Logs with Grafana Loki for under $1 a day ↩︎
- Size Matters: Best Practices for Trillion Row Datasets in ClickHouse ↩︎
- ApacheCon 2019 ↩︎
- Apache Con 2019 ↩︎
- Log Analytics Using Clickhouse ↩︎
- Dead Letter Queue ↩︎